Estimated Value: $587,000 - $1,141,000
--
Bed
--
Bath
2,461
Sq Ft
$369/Sq Ft
Est. Value
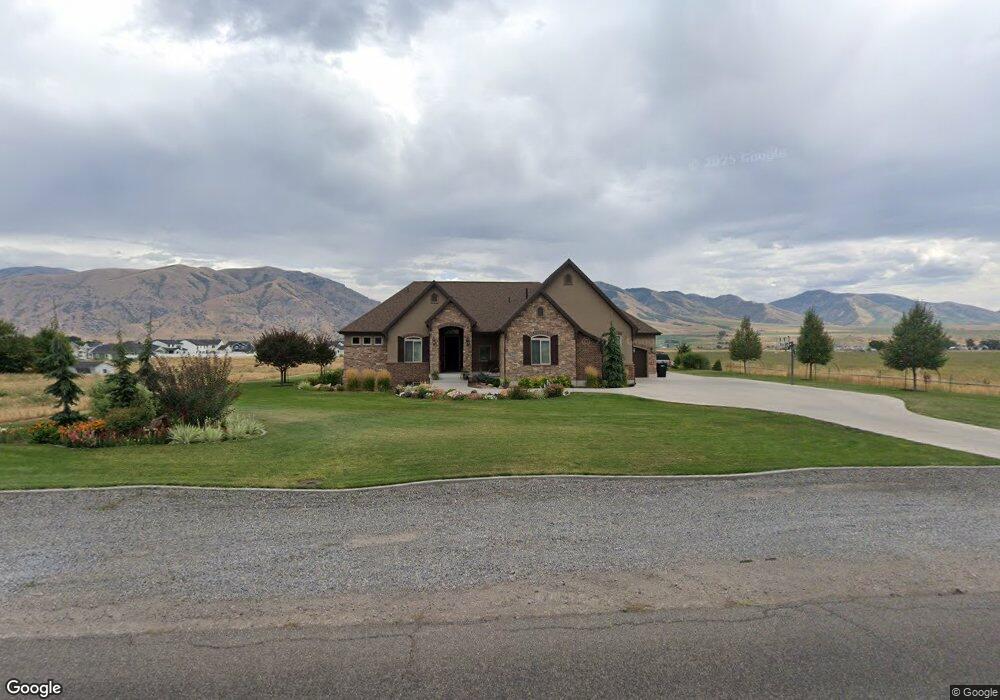
About This Home
This home is located at 645 S 300 E, Hyrum, UT 84319 and is currently estimated at $908,094, approximately $368 per square foot. 645 S 300 E is a home with nearby schools including Canyon School, South Cache Middle School, and Mountain Crest High School.
Ownership History
Date
Name
Owned For
Owner Type
Purchase Details
Closed on
Apr 19, 2012
Sold by
Gittins Larry G and Gittins Leslie J
Bought by
Nelson Michael N and Nelson Christene M
Current Estimated Value
Purchase Details
Closed on
Apr 29, 2008
Sold by
Northcom 24 Llc
Bought by
Nelson Michael N and Nelson Christene M
Purchase Details
Closed on
Oct 27, 2007
Sold by
Bradshaw W Garth and Bradshaw Rhonda
Bought by
Northcom 24 Llc
Create a Home Valuation Report for This Property
The Home Valuation Report is an in-depth analysis detailing your home's value as well as a comparison with similar homes in the area
Home Values in the Area
Average Home Value in this Area
Purchase History
| Date | Buyer | Sale Price | Title Company |
|---|---|---|---|
| Nelson Michael N | -- | Northern Title Company | |
| Nelson Michael N | -- | Northern Title Company | |
| Northcom 24 Llc | -- | Northern Title Company |
Source: Public Records
Tax History Compared to Growth
Tax History
| Year | Tax Paid | Tax Assessment Tax Assessment Total Assessment is a certain percentage of the fair market value that is determined by local assessors to be the total taxable value of land and additions on the property. | Land | Improvement |
|---|---|---|---|---|
| 2025 | $3,441 | $493,985 | $0 | $0 |
| 2024 | $3,689 | $494,660 | $0 | $0 |
| 2023 | $3,813 | $488,825 | $0 | $0 |
| 2022 | $3,979 | $488,825 | $0 | $0 |
| 2021 | $3,749 | $708,199 | $121,800 | $586,399 |
| 2020 | $3,565 | $631,713 | $121,800 | $509,913 |
| 2019 | $3,510 | $585,963 | $76,050 | $509,913 |
| 2018 | $3,292 | $531,330 | $76,050 | $455,280 |
| 2017 | $3,347 | $280,510 | $0 | $0 |
| 2016 | $3,423 | $94,905 | $0 | $0 |
| 2015 | $930 | $76,050 | $0 | $0 |
| 2014 | $909 | $76,005 | $0 | $0 |
| 2013 | -- | $76,005 | $0 | $0 |
Source: Public Records
Map
Nearby Homes
- 175 E 500 S
- 667 E 730 N
- 8 S 650 W
- 42 the Hideout at Scare
- 7500 S 1400 W
- 532 E 300 S
- 66 W 400 S
- 516 S 770 E
- 676 E 1100 S
- Ashland Plan at Canyon Estates
- Magnolia Plan at Canyon Estates
- Richmond Plan at Canyon Estates
- 565 E 100 S
- 685 E 1250 S
- 746 E 1250 S
- 730 E 1250 S
- 760 E 1250 S
- 651 E 20 S
- 28 N 100 E
- 478 S 1170 E