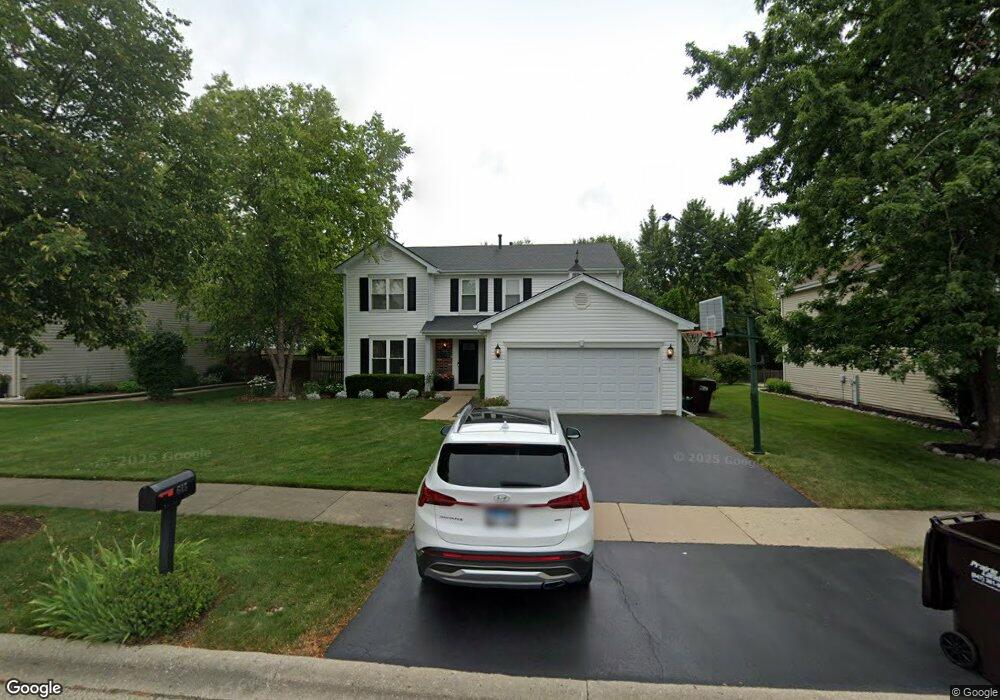
645 Shallow Cove Rd Lake Zurich, IL 60047
Estimated Value: $496,000 - $603,000
4
Beds
3
Baths
2,520
Sq Ft
$218/Sq Ft
Est. Value
About This Home
This home is located at 645 Shallow Cove Rd, Lake Zurich, IL 60047 and is currently estimated at $549,634, approximately $218 per square foot. 645 Shallow Cove Rd is a home located in Lake County with nearby schools including Isaac Fox Elementary School, Lake Zurich Middle School - South Campus, and Lake Zurich High School.
Ownership History
Date
Name
Owned For
Owner Type
Purchase Details
Closed on
Mar 25, 2025
Sold by
Luby Daniel J and Luby Pamela C
Bought by
Daniel J And Pamela C Luby Living Trust and Luby
Current Estimated Value
Purchase Details
Closed on
May 15, 1998
Sold by
Noffke Laurence and Noffke Kelly
Bought by
Luby Daniel J and Luby Pamela C
Home Financials for this Owner
Home Financials are based on the most recent Mortgage that was taken out on this home.
Original Mortgage
$185,000
Interest Rate
7.27%
Purchase Details
Closed on
Jan 5, 1996
Sold by
Pokryfke James T and Pokryfke Janet
Bought by
Noffke Laurence and Noffke Kelly
Create a Home Valuation Report for This Property
The Home Valuation Report is an in-depth analysis detailing your home's value as well as a comparison with similar homes in the area
Home Values in the Area
Average Home Value in this Area
Purchase History
| Date | Buyer | Sale Price | Title Company |
|---|---|---|---|
| Daniel J And Pamela C Luby Living Trust | -- | None Listed On Document | |
| Luby Daniel J | $236,000 | -- | |
| Noffke Laurence | $227,000 | Attorneys Natl Title Network |
Source: Public Records
Mortgage History
| Date | Status | Borrower | Loan Amount |
|---|---|---|---|
| Previous Owner | Luby Daniel J | $185,000 |
Source: Public Records
Tax History Compared to Growth
Tax History
| Year | Tax Paid | Tax Assessment Tax Assessment Total Assessment is a certain percentage of the fair market value that is determined by local assessors to be the total taxable value of land and additions on the property. | Land | Improvement |
|---|---|---|---|---|
| 2024 | $11,085 | $156,076 | $23,789 | $132,287 |
| 2023 | $11,085 | $148,906 | $22,696 | $126,210 |
| 2022 | $9,992 | $132,829 | $18,508 | $114,321 |
| 2021 | $9,646 | $129,425 | $18,034 | $111,391 |
| 2020 | $9,472 | $129,425 | $18,034 | $111,391 |
| 2019 | $9,327 | $128,296 | $17,877 | $110,419 |
| 2018 | $8,870 | $122,700 | $19,231 | $103,469 |
| 2017 | $8,810 | $121,221 | $18,999 | $102,222 |
| 2016 | $8,635 | $121,850 | $18,397 | $103,453 |
| 2015 | $8,853 | $116,059 | $17,523 | $98,536 |
| 2014 | $8,032 | $104,737 | $19,850 | $84,887 |
| 2012 | $7,963 | $104,958 | $19,892 | $85,066 |
Source: Public Records
Map
Nearby Homes
- 21186 W Preserve Dr
- 20992 W Preserve Dr
- 461 N Newberry Ct
- 22145 W White Pine Rd
- 21742 N Ashley St
- 22228 W Casa Bella View
- 22218 W Casa Bella View
- 20688 N Oliver Ct
- 20678 N Oliver Ct
- 22207 W Casa Bella View
- 22164 W Casa Bella View
- 22106 W Casa Bella View
- 22144 W Casa Bella View
- 22110 W Casa Bella View
- 22112 W Casa Bella View
- 22118 W Casa Bella View
- 22147 W Casa Bella View
- 22075 W Casa Bella View
- 21839 Cambridge Dr
- 22077 W Casa Bella View
- 655 Shallow Cove Rd
- 635 Shallow Cove Rd
- 630 Cypress Bridge Rd
- 640 Cypress Bridge Rd
- 665 Shallow Cove Rd
- 650 Cypress Bridge Rd
- 1724 Coral Reef Way
- 1744 Coral Reef Way
- 640 Shallow Cove Rd
- 1704 Coral Reef Way
- 650 Shallow Cove Rd
- 630 Shallow Cove Rd
- 675 Shallow Cove Rd
- 660 Cypress Bridge Rd
- 660 Shallow Cove Rd
- 1764 Coral Reef Way
- 670 Cypress Bridge Rd
- 685 Shallow Cove Rd
- 670 Shallow Cove Rd
- 645 Cypress Bridge Rd