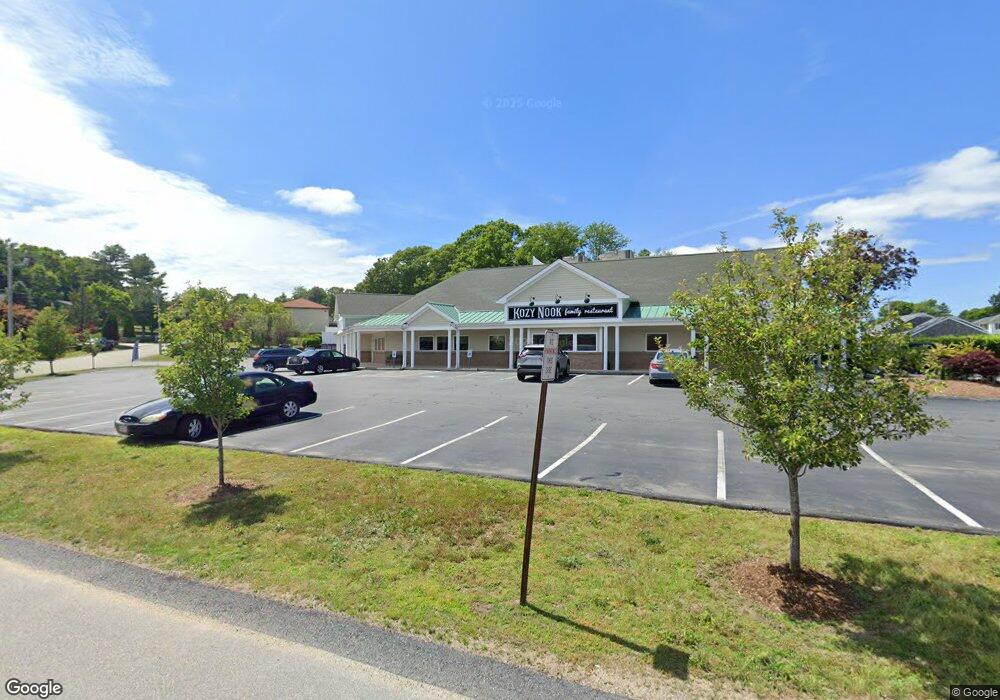
645 State Rd Unit b Westport, MA 02790
North Westport Neighborhood
Studio
--
Bath
6,130
Sq Ft
7,841
Sq Ft Lot Lot
About This Home
This home is located at 645 State Rd Unit b, Westport, MA 02790. 645 State Rd Unit b is a home located in Bristol County with nearby schools including Alice A. Macomber Primary School, Westport Elementary School, and Westport Middle-High School.
Ownership History
Date
Name
Owned For
Owner Type
Purchase Details
Closed on
Dec 29, 2004
Sold by
Abrams Jeffrey H
Bought by
Abrams Rlty
Purchase Details
Closed on
Sep 25, 1996
Sold by
Manchester Stanley R
Bought by
Abrams Jeffrey H
Purchase Details
Closed on
Jul 30, 1987
Sold by
Mosher Ralph M
Bought by
Manchester Stanley R
Create a Home Valuation Report for This Property
The Home Valuation Report is an in-depth analysis detailing your home's value as well as a comparison with similar homes in the area
Home Values in the Area
Average Home Value in this Area
Purchase History
We collect this data history from publicly available records. To have your information removed, we recommend requesting removal directly through your county’s website.
| Date | Buyer | Sale Price | Title Company |
|---|---|---|---|
| Abrams Rlty | -- | -- | |
| Abrams Rlty | -- | -- | |
| Abrams Jeffrey H | $150,000 | -- | |
| Abrams Jeffrey H | $150,000 | -- | |
| Manchester Stanley R | $200,000 | -- |
Source: Public Records
Mortgage History
We collect this data history from publicly available records. To have your information removed, we recommend requesting removal directly through your county’s website.
| Date | Status | Borrower | Loan Amount |
|---|---|---|---|
| Open | Manchester Stanley R | $383,000 | |
| Closed | Manchester Stanley R | $530,000 |
Source: Public Records
Tax History
| Year | Tax Paid | Tax Assessment Tax Assessment Total Assessment is a certain percentage of the fair market value that is determined by local assessors to be the total taxable value of land and additions on the property. | Land | Improvement |
|---|---|---|---|---|
| 2025 | $5,583 | $749,400 | $225,300 | $524,100 |
| 2024 | $5,631 | $728,400 | $204,300 | $524,100 |
| 2023 | $5,726 | $701,700 | $191,300 | $510,400 |
| 2022 | $5,741 | $677,000 | $191,300 | $485,700 |
| 2021 | $5,686 | $659,600 | $173,900 | $485,700 |
| 2020 | $5,423 | $643,300 | $173,900 | $469,400 |
| 2019 | $5,407 | $653,800 | $173,900 | $479,900 |
| 2018 | $2,711 | $652,800 | $168,100 | $484,700 |
| 2017 | $5,240 | $657,500 | $168,100 | $489,400 |
| 2016 | $5,201 | $657,500 | $168,100 | $489,400 |
| 2015 | $5,252 | $662,300 | $168,100 | $494,200 |
Source: Public Records
Map
Nearby Homes
- 127 Gifford Rd
- 16 Lenox Ave
- 32 Madison Ct
- 0 Hertitage Acres
- 100 D Dr
- 3 Diane Way
- 350 Gifford Rd
- 565 Highland Ave
- 26 James Ave
- 343 Old Bedford Rd
- 258 Sanford Rd
- 320-322 Old Bedford Rd
- 6 Beaulieu St
- 50 Benoit St
- 0 Bergeron Ln Unit 73483440
- 1163 Old Fall River Rd
- 128 Old Bedford Rd
- 1148 American Legion Hwy
- 21 Evergreen St
- 222 Blossom Rd
Your Personal Tour Guide
Ask me questions while you tour the home.