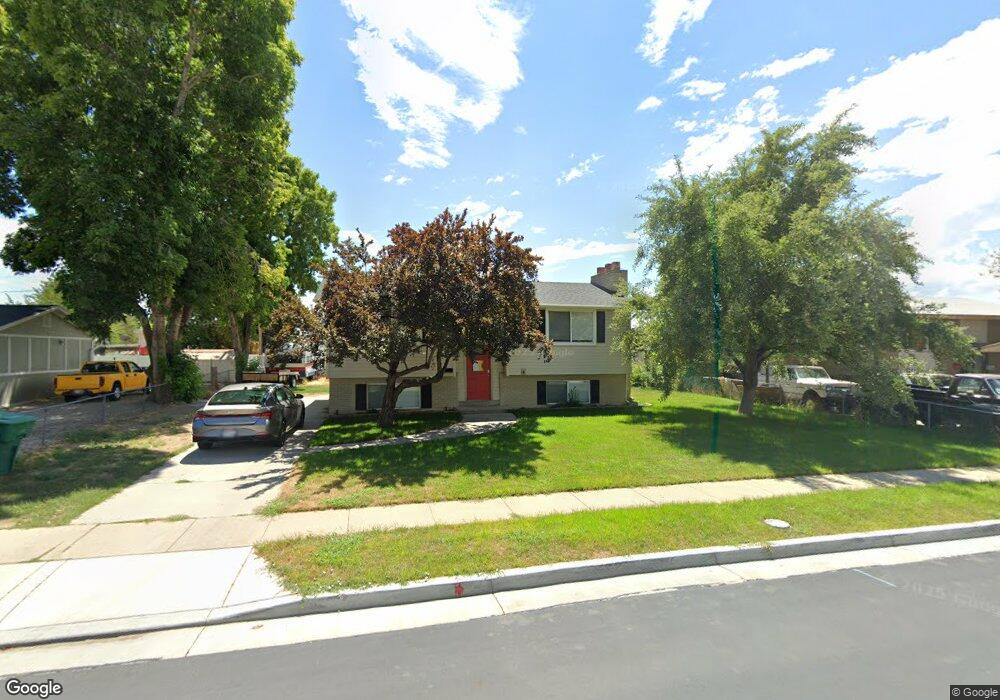
645 W 5735 S Salt Lake City, UT 84123
Estimated Value: $443,000 - $505,000
4
Beds
2
Baths
828
Sq Ft
$560/Sq Ft
Est. Value
About This Home
This home is located at 645 W 5735 S, Salt Lake City, UT 84123 and is currently estimated at $463,367, approximately $559 per square foot. 645 W 5735 S is a home located in Salt Lake County with nearby schools including Viewmont Elementary School, Riverview Junior High School, and Murray High School.
Ownership History
Date
Name
Owned For
Owner Type
Purchase Details
Closed on
Oct 13, 1995
Sold by
Simpson Glen L and Simpson Marietta G
Bought by
Phillips Dean H and Phillips Marci A
Current Estimated Value
Home Financials for this Owner
Home Financials are based on the most recent Mortgage that was taken out on this home.
Original Mortgage
$92,025
Outstanding Balance
$658
Interest Rate
7.8%
Mortgage Type
FHA
Estimated Equity
$462,709
Create a Home Valuation Report for This Property
The Home Valuation Report is an in-depth analysis detailing your home's value as well as a comparison with similar homes in the area
Home Values in the Area
Average Home Value in this Area
Purchase History
| Date | Buyer | Sale Price | Title Company |
|---|---|---|---|
| Phillips Dean H | -- | -- |
Source: Public Records
Mortgage History
| Date | Status | Borrower | Loan Amount |
|---|---|---|---|
| Open | Phillips Dean H | $92,025 |
Source: Public Records
Tax History Compared to Growth
Tax History
| Year | Tax Paid | Tax Assessment Tax Assessment Total Assessment is a certain percentage of the fair market value that is determined by local assessors to be the total taxable value of land and additions on the property. | Land | Improvement |
|---|---|---|---|---|
| 2025 | $1,805 | $415,300 | $107,900 | $307,400 |
| 2024 | $1,805 | $400,300 | $104,100 | $296,200 |
| 2023 | $1,805 | $351,100 | $97,300 | $253,800 |
| 2022 | $1,776 | $358,600 | $95,400 | $263,200 |
| 2021 | $1,529 | $272,400 | $71,600 | $200,800 |
| 2020 | $1,461 | $246,200 | $71,600 | $174,600 |
| 2019 | $1,501 | $244,400 | $71,600 | $172,800 |
| 2018 | $1,367 | $227,200 | $69,600 | $157,600 |
| 2017 | $1,278 | $214,100 | $69,600 | $144,500 |
| 2016 | $1,245 | $201,400 | $69,600 | $131,800 |
| 2015 | $1,291 | $189,600 | $67,900 | $121,700 |
| 2014 | $1,230 | $179,200 | $64,700 | $114,500 |
Source: Public Records
Map
Nearby Homes
- 5730 S 590 W
- 5689 S Spacerama Dr
- 523 W Loyal Dr
- 5513 S 670 W
- 5964 S 610 W
- 910 W Brandermill Cove
- Santa Monica Towns Plan at Murray Heights
- Huntington Towns Plan at Murray Heights
- 5517 S White Springs Dr
- 909 W Bullion St Unit 11
- 912 W Bellshill Dr Unit 15
- 924 Coalburn Way Unit 8-26
- 923 Coalburn Way Unit 103
- 5495 S White Springs Dr
- 931 Coalburn Way Unit 102
- 937 Coalburn Way Unit 102
- 6080 S 700 W
- 5730 S 180 W
- Sargent Plan at The Gallery at Bullion - Single Family Homes
- Gomez Plan at The Gallery at Bullion - Single Family Homes