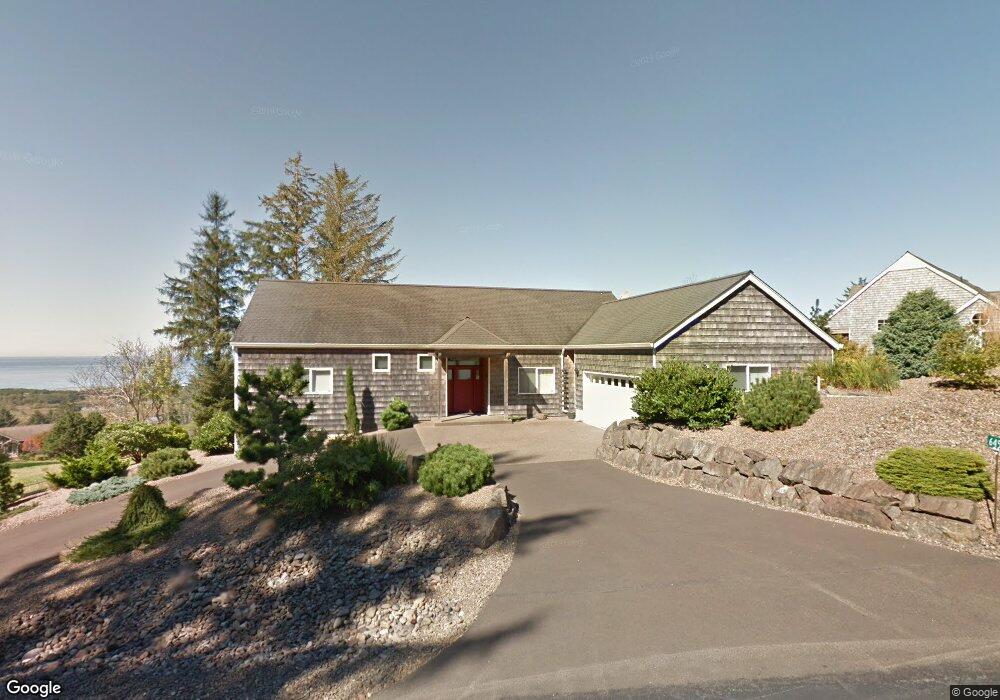
6450 Pacific Overlook Dr Neskowin, OR 97149
Estimated Value: $878,067 - $1,364,000
3
Beds
2
Baths
2,261
Sq Ft
$474/Sq Ft
Est. Value
About This Home
This home is located at 6450 Pacific Overlook Dr, Neskowin, OR 97149 and is currently estimated at $1,072,267, approximately $474 per square foot. 6450 Pacific Overlook Dr is a home located in Tillamook County with nearby schools including Nestucca K-8 School and Nestucca High School.
Ownership History
Date
Name
Owned For
Owner Type
Purchase Details
Closed on
Oct 7, 2016
Sold by
Graves Tom L and Graves Thomas L
Bought by
Graves Thomas L and Hubbard Hedy M
Current Estimated Value
Home Financials for this Owner
Home Financials are based on the most recent Mortgage that was taken out on this home.
Original Mortgage
$390,000
Outstanding Balance
$310,671
Interest Rate
3.43%
Mortgage Type
New Conventional
Estimated Equity
$761,596
Purchase Details
Closed on
Dec 6, 2005
Sold by
Elsheimer Marvin N and Elsheimer Patricia
Bought by
Graves Tom L
Home Financials for this Owner
Home Financials are based on the most recent Mortgage that was taken out on this home.
Original Mortgage
$350,998
Interest Rate
6.14%
Mortgage Type
Fannie Mae Freddie Mac
Create a Home Valuation Report for This Property
The Home Valuation Report is an in-depth analysis detailing your home's value as well as a comparison with similar homes in the area
Home Values in the Area
Average Home Value in this Area
Purchase History
| Date | Buyer | Sale Price | Title Company |
|---|---|---|---|
| Graves Thomas L | -- | Western Title & Escrow | |
| Graves Tom L | $555,000 | Ticor Title Ins Co |
Source: Public Records
Mortgage History
| Date | Status | Borrower | Loan Amount |
|---|---|---|---|
| Open | Graves Thomas L | $390,000 | |
| Closed | Graves Tom L | $350,998 |
Source: Public Records
Tax History Compared to Growth
Tax History
| Year | Tax Paid | Tax Assessment Tax Assessment Total Assessment is a certain percentage of the fair market value that is determined by local assessors to be the total taxable value of land and additions on the property. | Land | Improvement |
|---|---|---|---|---|
| 2024 | $6,265 | $528,060 | $158,760 | $369,300 |
| 2023 | $6,289 | $512,680 | $154,130 | $358,550 |
| 2022 | $6,066 | $497,750 | $149,650 | $348,100 |
| 2021 | $5,896 | $483,260 | $145,300 | $337,960 |
| 2020 | $5,752 | $469,190 | $141,070 | $328,120 |
| 2019 | $5,635 | $455,530 | $136,960 | $318,570 |
| 2018 | $5,193 | $442,270 | $132,970 | $309,300 |
| 2017 | $4,915 | $429,390 | $129,090 | $300,300 |
| 2016 | $4,530 | $416,890 | $125,330 | $291,560 |
| 2015 | $4,680 | $404,750 | $121,680 | $283,070 |
| 2014 | $4,566 | $392,970 | $118,140 | $274,830 |
| 2013 | -- | $381,530 | $114,700 | $266,830 |
Source: Public Records
Map
Nearby Homes
- 57 Surf View Dr
- 57 Surfview Dr
- 46615 Highway 101 S
- 0 Scherzinger Rd Unit 188901334
- Lot 60 Valhalla Dr
- Lot 61 Valhalla Dr
- V/L 6500 Hill Crest Dr
- TL54 Pelican Point
- TL52 Pelican Point Unit Lot 52
- TL51 Pelican Point
- TL53 Pelican Point
- TL48 Vanora
- TL46 Vanora St
- TL47 Vanora St
- 0 Pelican Point Unit 51 423886857
- 0 Pelican Point Unit 53 656740579
- 0 Pelican Point Unit 52 386403533
- 0 Pelican Point Unit 54 251015667
- 0 Pelican Point Unit 55 423751847
- 6485 Heron View
- 6460 Pacific Overlook Dr
- 6400 Pacific Overlook Dr
- 6720 Pacific Overlook Dr
- 6470 Pacific Overlook Dr
- 6700 Pacific Overlook Dr
- 6465 Pacific Overlook Dr
- 6 Pacific Overlook Dr Unit 1
- 6 Pacific Overlook Dr Unit 2
- 22 Pacific Overlook Dr
- 39 Pacific Overlook Dr
- 800 Pacific Overlook Dr Unit 800
- 39 Pacific Overlook Dr Unit 39
- 36 Pacific Overlook Dr Unit 36
- 44 Pacific Overlook Dr
- 6475 Pacific Overlook Dr
- 6690 Pacific Overlook Dr
- V/L Pacific Overlook Dr
- NA Pacific Overlook Dr
- Lot 6 Pacific Overlook Dr
- Lot 6 Pacific Overlook Dr