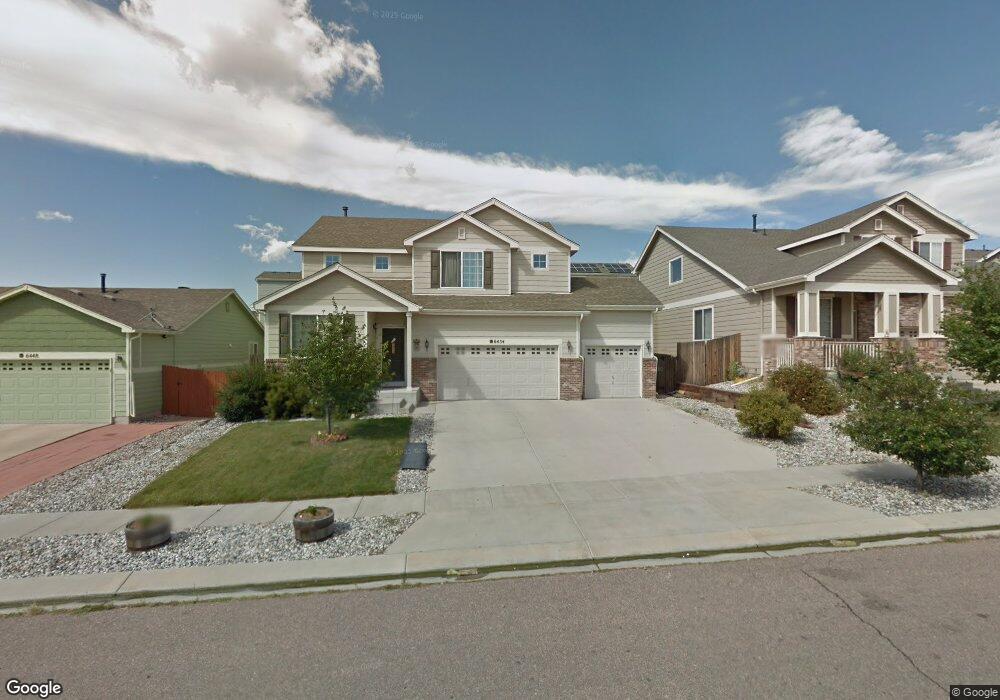
6454 Alibi Cir Colorado Springs, CO 80923
Ridgeview NeighborhoodEstimated Value: $522,000 - $550,000
4
Beds
3
Baths
2,204
Sq Ft
$240/Sq Ft
Est. Value
About This Home
This home is located at 6454 Alibi Cir, Colorado Springs, CO 80923 and is currently estimated at $529,983, approximately $240 per square foot. 6454 Alibi Cir is a home located in El Paso County with nearby schools including Ridgeview Elementary School, Skyview Middle School, and Vista Ridge High School.
Ownership History
Date
Name
Owned For
Owner Type
Purchase Details
Closed on
Aug 28, 2019
Sold by
Redouane Darian
Bought by
Klonowski Joseph and Klonowski Kimberlin
Current Estimated Value
Home Financials for this Owner
Home Financials are based on the most recent Mortgage that was taken out on this home.
Original Mortgage
$298,400
Outstanding Balance
$262,438
Interest Rate
3.8%
Mortgage Type
New Conventional
Estimated Equity
$267,545
Purchase Details
Closed on
Aug 16, 2018
Sold by
Bullock Jason P and Bullock Natalei K
Bought by
Redouane Darin
Purchase Details
Closed on
Sep 30, 2005
Sold by
Richmond American Homes Of Colorado Inc
Bought by
Bullock Jason P and Bullock Natalei K
Home Financials for this Owner
Home Financials are based on the most recent Mortgage that was taken out on this home.
Original Mortgage
$192,512
Interest Rate
5.73%
Mortgage Type
Fannie Mae Freddie Mac
Create a Home Valuation Report for This Property
The Home Valuation Report is an in-depth analysis detailing your home's value as well as a comparison with similar homes in the area
Home Values in the Area
Average Home Value in this Area
Purchase History
| Date | Buyer | Sale Price | Title Company |
|---|---|---|---|
| Klonowski Joseph | $373,000 | Land Title Guarantee Co | |
| Redouane Darin | $312,000 | Land Title Guarantee Co | |
| Bullock Jason P | $240,600 | -- |
Source: Public Records
Mortgage History
| Date | Status | Borrower | Loan Amount |
|---|---|---|---|
| Open | Klonowski Joseph | $298,400 | |
| Previous Owner | Bullock Jason P | $192,512 |
Source: Public Records
Tax History Compared to Growth
Tax History
| Year | Tax Paid | Tax Assessment Tax Assessment Total Assessment is a certain percentage of the fair market value that is determined by local assessors to be the total taxable value of land and additions on the property. | Land | Improvement |
|---|---|---|---|---|
| 2025 | $1,966 | $36,790 | -- | -- |
| 2024 | $1,742 | $36,850 | $4,620 | $32,230 |
| 2023 | $1,742 | $34,800 | $4,620 | $30,180 |
| 2022 | $1,545 | $26,510 | $4,170 | $22,340 |
| 2021 | $1,611 | $27,270 | $4,290 | $22,980 |
| 2020 | $1,410 | $23,590 | $3,580 | $20,010 |
| 2019 | $1,395 | $23,590 | $3,580 | $20,010 |
| 2018 | $1,254 | $20,780 | $3,020 | $17,760 |
| 2017 | $1,260 | $20,780 | $3,020 | $17,760 |
| 2016 | $1,268 | $20,610 | $2,950 | $17,660 |
| 2015 | $1,269 | $20,610 | $2,950 | $17,660 |
| 2014 | $1,159 | $18,450 | $2,790 | $15,660 |
Source: Public Records
Map
Nearby Homes
- 6351 Balance Cir
- 6430 Advocate Dr
- 6280 Balance Cir
- 6446 Elsinore Dr
- 6475 Galeta Dr
- 6452 Borough Dr
- 6323 Galeta Dr
- 6429 Borough Dr
- 6605 Donahue Dr
- 6041 Chivalry Dr
- 6432 Crystal Mountain Rd
- 6239 Hartman Dr
- 6218 Finglas Dr
- 6157 Finglas Dr
- 6105 New Colt Grove
- 6460 Lasso Grande Point
- 6218 Escalade Point
- 6088 Sierra Grande Point
- 6578 Summer Grace St
- 6513 Fowler Dr
- 6448 Alibi Cir
- 6460 Alibi Cir
- 6443 Advocate Dr
- 6442 Alibi Cir
- 6466 Alibi Cir
- 6449 Advocate Dr
- 6437 Advocate Dr
- 6455 Advocate Dr
- 6431 Advocate Dr
- 6455 Alibi Cir
- 6449 Alibi Cir
- 6472 Alibi Cir
- 6436 Alibi Cir
- 6443 Alibi Cir
- 6467 Alibi Cir
- 6461 Advocate Dr
- 6425 Advocate Dr
- 6437 Alibi Cir
- 6473 Alibi Cir
- 6502 Alibi Cir