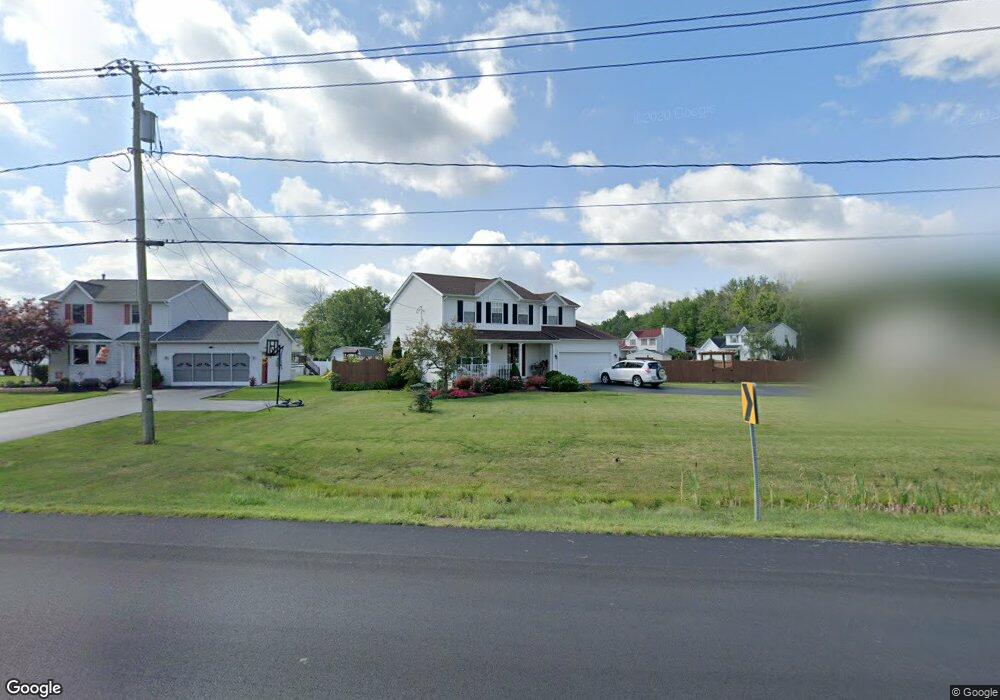
6456 Rapids Rd Lockport, NY 14094
Estimated Value: $309,000 - $410,526
4
Beds
3
Baths
1,700
Sq Ft
$222/Sq Ft
Est. Value
About This Home
This home is located at 6456 Rapids Rd, Lockport, NY 14094 and is currently estimated at $377,382, approximately $221 per square foot. 6456 Rapids Rd is a home located in Niagara County with nearby schools including Fricano Primary School, Regan Intermediate School, and Starpoint Middle School.
Ownership History
Date
Name
Owned For
Owner Type
Purchase Details
Closed on
Jan 12, 2009
Sold by
Elmore Brian
Bought by
Schoenfeld Thomas
Current Estimated Value
Home Financials for this Owner
Home Financials are based on the most recent Mortgage that was taken out on this home.
Original Mortgage
$140,000
Outstanding Balance
$92,247
Interest Rate
5.99%
Mortgage Type
New Conventional
Estimated Equity
$285,135
Purchase Details
Closed on
Mar 1, 2006
Sold by
Nash Michael
Bought by
Elmore Brian
Home Financials for this Owner
Home Financials are based on the most recent Mortgage that was taken out on this home.
Original Mortgage
$161,500
Interest Rate
6.16%
Mortgage Type
New Conventional
Purchase Details
Closed on
Jun 6, 2000
Sold by
Sciandra Building & Construction Inc
Bought by
Nash Michael J
Purchase Details
Closed on
Mar 26, 1999
Sold by
Pies Roger A
Bought by
Sciandra Building & Constructi
Create a Home Valuation Report for This Property
The Home Valuation Report is an in-depth analysis detailing your home's value as well as a comparison with similar homes in the area
Home Values in the Area
Average Home Value in this Area
Purchase History
| Date | Buyer | Sale Price | Title Company |
|---|---|---|---|
| Schoenfeld Thomas | $165,000 | Nancy Saia | |
| Schoenfeld Thomas | $165,000 | Nancy Saia | |
| Elmore Brian | $170,000 | Nicholas Sargent | |
| Nash Michael J | $125,000 | Angela Stamm-Phillips | |
| Sciandra Building & Constructi | -- | -- |
Source: Public Records
Mortgage History
| Date | Status | Borrower | Loan Amount |
|---|---|---|---|
| Open | Schoenfeld Thomas | $140,000 | |
| Closed | Schoenfeld Thomas | $140,000 | |
| Previous Owner | Elmore Brian | $161,500 |
Source: Public Records
Tax History Compared to Growth
Tax History
| Year | Tax Paid | Tax Assessment Tax Assessment Total Assessment is a certain percentage of the fair market value that is determined by local assessors to be the total taxable value of land and additions on the property. | Land | Improvement |
|---|---|---|---|---|
| 2024 | $6,461 | $279,000 | $25,600 | $253,400 |
| 2023 | $6,461 | $268,000 | $20,600 | $247,400 |
| 2022 | $6,465 | $233,000 | $20,600 | $212,400 |
| 2021 | $6,972 | $212,400 | $30,000 | $182,400 |
| 2020 | $5,887 | $212,400 | $30,000 | $182,400 |
| 2019 | $5,376 | $198,700 | $30,000 | $168,700 |
| 2018 | $5,276 | $178,000 | $30,000 | $148,000 |
| 2017 | $5,376 | $178,000 | $30,000 | $148,000 |
| 2016 | $5,195 | $168,100 | $30,000 | $138,100 |
| 2015 | -- | $168,100 | $30,000 | $138,100 |
| 2014 | -- | $159,900 | $28,000 | $131,900 |
Source: Public Records
Map
Nearby Homes
- 6543 Emily Ln
- 6410 Beach Dr
- Patriot Plan at Heather Woods
- Patio C Plan at Heather Woods
- Patio B Plan at Heather Woods
- Patio A Plan at Heather Woods
- Heritage IX Plan at Heather Woods
- Heritage I Plan at Heather Woods
- Heritage II Plan at Heather Woods
- Discovery XIV Plan at Heather Woods
- Discovery XII Plan at Heather Woods
- Discovery XI Plan at Heather Woods
- Discovery IX Plan at Heather Woods
- Discovery VII Plan at Heather Woods
- Discovery X Plan at Heather Woods
- Discovery II Plan at Heather Woods
- Elite XII Plan at Heather Woods
- Avalon Plan at Heather Woods
- Advantage XII Plan at Heather Woods
- Advantage X Plan at Heather Woods
- 6458 Rapids Rd
- 6507 Emily Ln
- 6452 Rapids Rd
- 6502 Emily Ln
- 6457 Rapids Rd
- 6459 Brian Walk
- 6506 Emily Ln
- 6453 Rapids Rd
- 6462 Rapids Rd
- 6459 Rapids Rd
- 6450 Rapids Rd
- 6510 Emily Ln
- 6451 Rapids Rd
- 6463 Brian Walk
- 6461 Rapids Rd
- 6344 Rebecca Rd
- 6464 Rapids Rd
- 6346 Rebecca Rd
- 6449 Rapids Rd
- 6458 Brian Walk