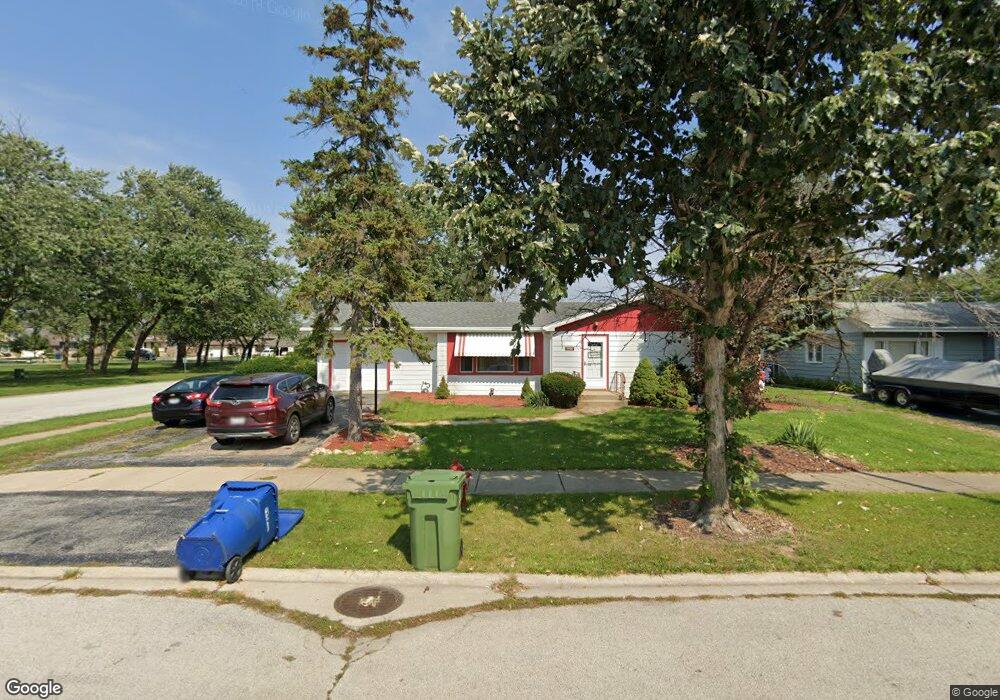
6456 W 93rd Place Oak Lawn, IL 60453
Estimated Value: $285,000 - $322,000
3
Beds
1
Bath
1,036
Sq Ft
$291/Sq Ft
Est. Value
About This Home
This home is located at 6456 W 93rd Place, Oak Lawn, IL 60453 and is currently estimated at $301,610, approximately $291 per square foot. 6456 W 93rd Place is a home located in Cook County with nearby schools including George W Lieb Elementary School, Simmons Middle School, and Oak Lawn Community High School.
Ownership History
Date
Name
Owned For
Owner Type
Purchase Details
Closed on
May 30, 2017
Sold by
Rehikling Erik J and Rehling Lindy
Bought by
Sarah Burke William and Sarah Zaorkki
Current Estimated Value
Home Financials for this Owner
Home Financials are based on the most recent Mortgage that was taken out on this home.
Original Mortgage
$189,504
Outstanding Balance
$159,115
Interest Rate
4.37%
Mortgage Type
FHA
Estimated Equity
$142,495
Purchase Details
Closed on
Sep 8, 2011
Sold by
Oelkers Lynn
Bought by
Rehling Erik J
Home Financials for this Owner
Home Financials are based on the most recent Mortgage that was taken out on this home.
Original Mortgage
$121,831
Interest Rate
4.25%
Mortgage Type
FHA
Purchase Details
Closed on
Oct 2, 2006
Sold by
Winkler Edwin W
Bought by
Winkler Edwin W and Declaration Of Trust Of Edwin W Winkler
Create a Home Valuation Report for This Property
The Home Valuation Report is an in-depth analysis detailing your home's value as well as a comparison with similar homes in the area
Home Values in the Area
Average Home Value in this Area
Purchase History
| Date | Buyer | Sale Price | Title Company |
|---|---|---|---|
| Sarah Burke William | $193,000 | Fidelity National Title | |
| Rehling Erik J | $125,000 | Fidelity National Title | |
| Winkler Edwin W | -- | None Available |
Source: Public Records
Mortgage History
| Date | Status | Borrower | Loan Amount |
|---|---|---|---|
| Open | Sarah Burke William | $189,504 | |
| Previous Owner | Rehling Erik J | $121,831 |
Source: Public Records
Tax History Compared to Growth
Tax History
| Year | Tax Paid | Tax Assessment Tax Assessment Total Assessment is a certain percentage of the fair market value that is determined by local assessors to be the total taxable value of land and additions on the property. | Land | Improvement |
|---|---|---|---|---|
| 2024 | $6,102 | $21,000 | $6,406 | $14,594 |
| 2023 | $5,480 | $21,000 | $6,406 | $14,594 |
| 2022 | $5,480 | $15,603 | $5,637 | $9,966 |
| 2021 | $5,310 | $15,602 | $5,636 | $9,966 |
| 2020 | $5,203 | $15,602 | $5,636 | $9,966 |
| 2019 | $4,806 | $14,802 | $5,124 | $9,678 |
| 2018 | $4,605 | $14,802 | $5,124 | $9,678 |
| 2017 | $3,605 | $14,802 | $5,124 | $9,678 |
| 2016 | $3,412 | $12,660 | $4,355 | $8,305 |
| 2015 | $3,344 | $12,660 | $4,355 | $8,305 |
| 2014 | $3,332 | $12,660 | $4,355 | $8,305 |
| 2013 | $3,788 | $15,224 | $4,355 | $10,869 |
Source: Public Records
Map
Nearby Homes
- 9208 Nashville Ave
- 9108 Crescent Ct
- 6632 W 95th St Unit 2C
- 6237 W 94th St Unit 3S
- 6634 W 95th St Unit 1D
- 6541 Crescent Ct
- 6705 W 91st Place
- 9607 Marion Ave
- 9611 Merton Ave
- 6346 W 90th St
- 9236 Stanford Dr
- 6313 W 89th Place
- 9725 Ridgeland Ave Unit 1N
- 6455 W 88th Place
- 9128 Pembroke Ln
- 9729 Merton Ave
- 6821 Saratoga Dr
- 9258 Austin Ave
- 9725 Normandy Ave
- 6906 W 91st St
- 6450 W 93rd Place
- 6455 W 93rd St
- 6449 W 93rd St
- 6444 W 93rd Place
- 6443 W 93rd St
- 6436 W 93rd Place
- 6443 W 93rd Place
- 6435 W 93rd St
- 6435 W 93rd Place
- 6428 W 93rd Place
- 6436 W 93rd St
- 6432 W 93rd St
- 6427 W 93rd St
- 6427 W 93rd Place
- 6428 W 93rd St
- 6444 W 94th St
- 6502 W 93rd St
- 6506 W 93rd St
- 6420 W 93rd Place
- 6436 W 94th St