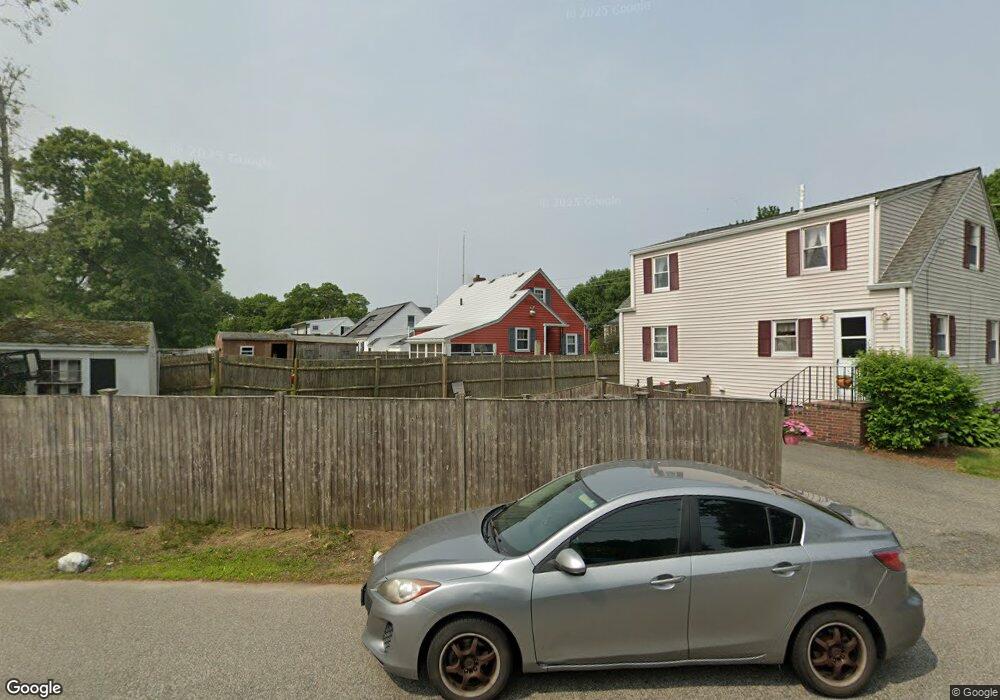
646 Ash St Brockton, MA 02301
Clifton Heights NeighborhoodEstimated Value: $387,000 - $548,000
2
Beds
2
Baths
980
Sq Ft
$458/Sq Ft
Est. Value
About This Home
This home is located at 646 Ash St, Brockton, MA 02301 and is currently estimated at $448,904, approximately $458 per square foot. 646 Ash St is a home located in Plymouth County with nearby schools including Gilmore Elementary School, John F. Kennedy Elementary School, and Davis K-8 School.
Ownership History
Date
Name
Owned For
Owner Type
Purchase Details
Closed on
May 14, 1990
Sold by
Havey Steven F
Bought by
Serrilla Joseph F
Current Estimated Value
Home Financials for this Owner
Home Financials are based on the most recent Mortgage that was taken out on this home.
Original Mortgage
$121,500
Interest Rate
10.15%
Mortgage Type
Purchase Money Mortgage
Create a Home Valuation Report for This Property
The Home Valuation Report is an in-depth analysis detailing your home's value as well as a comparison with similar homes in the area
Home Values in the Area
Average Home Value in this Area
Purchase History
| Date | Buyer | Sale Price | Title Company |
|---|---|---|---|
| Serrilla Joseph F | $135,000 | -- |
Source: Public Records
Mortgage History
| Date | Status | Borrower | Loan Amount |
|---|---|---|---|
| Closed | Serrilla Joseph F | $121,500 |
Source: Public Records
Tax History
| Year | Tax Paid | Tax Assessment Tax Assessment Total Assessment is a certain percentage of the fair market value that is determined by local assessors to be the total taxable value of land and additions on the property. | Land | Improvement |
|---|---|---|---|---|
| 2025 | $4,415 | $364,600 | $143,900 | $220,700 |
| 2024 | $4,343 | $361,300 | $143,900 | $217,400 |
| 2023 | $4,178 | $321,900 | $108,600 | $213,300 |
| 2022 | $4,148 | $296,900 | $98,600 | $198,300 |
| 2021 | $0 | $274,500 | $90,900 | $183,600 |
| 2020 | $8,965 | $245,500 | $87,400 | $158,100 |
| 2019 | $3,666 | $235,900 | $80,700 | $155,200 |
| 2018 | $4,377 | $212,900 | $80,700 | $132,200 |
| 2017 | $3,247 | $201,700 | $80,700 | $121,000 |
| 2016 | $3,383 | $194,900 | $73,000 | $121,900 |
| 2015 | $2,868 | $158,000 | $73,000 | $85,000 |
| 2014 | $2,767 | $152,600 | $73,000 | $79,600 |
Source: Public Records
Map
Nearby Homes
Your Personal Tour Guide
Ask me questions while you tour the home.