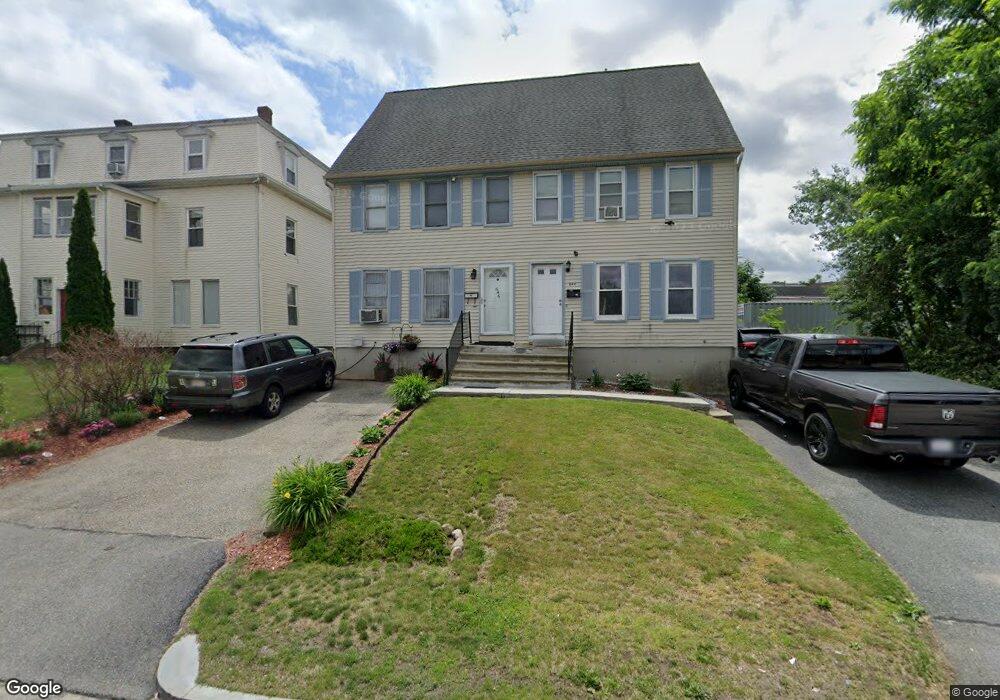
646 Franklin St Worcester, MA 01604
Franklin Plantation NeighborhoodEstimated Value: $302,000 - $436,000
About This Home
This home is located at 646 Franklin St, Worcester, MA 01604 and is currently estimated at $360,506, approximately $308 per square foot. 646 Franklin St is a home located in Worcester County with nearby schools including Jacob Hiatt Magnet School, Chandler Magnet, and Grafton Street.
Ownership History
We collect this data history from publicly available records. To have your information removed, we recommend requesting removal directly through your county’s website.
Purchase Details
Home Financials for this Owner
Home Financials are based on the most recent Mortgage that was taken out on this home.Purchase Details
Purchase Details
Home Financials for this Owner
Home Financials are based on the most recent Mortgage that was taken out on this home.Home Values in the Area
Average Home Value in this Area
Purchase History
We collect this data history from publicly available records. To have your information removed, we recommend requesting removal directly through your county’s website.
| Date | Buyer | Sale Price | Title Company |
|---|---|---|---|
| $125,000 | -- | ||
| $201,727 | -- | ||
| $131,000 | -- |
Mortgage History
We collect this data history from publicly available records. To have your information removed, we recommend requesting removal directly through your county’s website.
| Date | Status | Borrower | Loan Amount |
|---|---|---|---|
| Open | $123,068 | ||
| Previous Owner | $139,000 | ||
| Previous Owner | $13,390 | ||
| Previous Owner | $117,900 |
Tax History
We collect this data history from publicly available records. To have your information removed, we recommend requesting removal directly through your county’s website.
| Year | Tax Paid | Tax Assessment Tax Assessment Total Assessment is a certain percentage of the fair market value that is determined by local assessors to be the total taxable value of land and additions on the property. | Land | Improvement |
|---|---|---|---|---|
| 2025 | $3,983 | $302,000 | $83,800 | $218,200 |
| 2024 | $3,792 | $275,800 | $83,800 | $192,000 |
| 2023 | $3,594 | $250,600 | $72,900 | $177,700 |
| 2022 | $3,287 | $216,100 | $58,300 | $157,800 |
| 2021 | $3,080 | $189,200 | $46,700 | $142,500 |
| 2020 | $3,012 | $177,200 | $46,700 | $130,500 |
| 2019 | $2,898 | $161,000 | $42,000 | $119,000 |
| 2018 | $2,906 | $153,700 | $42,000 | $111,700 |
| 2017 | $2,752 | $143,200 | $42,000 | $101,200 |
| 2016 | $2,696 | $130,800 | $31,800 | $99,000 |
| 2015 | $2,625 | $130,800 | $31,800 | $99,000 |
| 2014 | $2,556 | $130,800 | $31,800 | $99,000 |
Map
- 1 Envelope Terrace Unit 309
- 16 Caprera Rd
- 29 Chilmark St
- 9 Caprera Rd
- 18 Frongillo Farm Rd
- 25 Johnson St
- 43 Robin Rd
- 64 Fairmont Ave
- 22 Frank St
- 8 Carver St
- 89 Gage St
- 34 Dartmouth St
- 25 Almont Ave
- 6 Harrington Way
- 81 Pilgrim Ave
- 20 Groton Place
- 80 Stanton St Unit 36
- 5 Anna St
- 1 Ralph Ave
- 109 Hamilton St
- 650 Franklin St
- 658 Franklin St
- 251 Plantation St
- 247 Plantation St
- 253 Plantation St
- 660 Franklin St Unit 3R
- 660 Franklin St Unit 2R
- 660 Franklin St
- 662 Franklin St
- 245 Plantation St
- 255 Plantation St
- 257 Plantation St
- 664 Franklin St
- 631 Franklin St Unit 204
- 631 Franklin St Unit 206
- 631 Franklin St Unit 203
- 631 Franklin St Unit 209
- 631 Franklin St Unit 106
- 631 Franklin St Unit 308
- 631 Franklin St
Ask me questions while you tour the home.