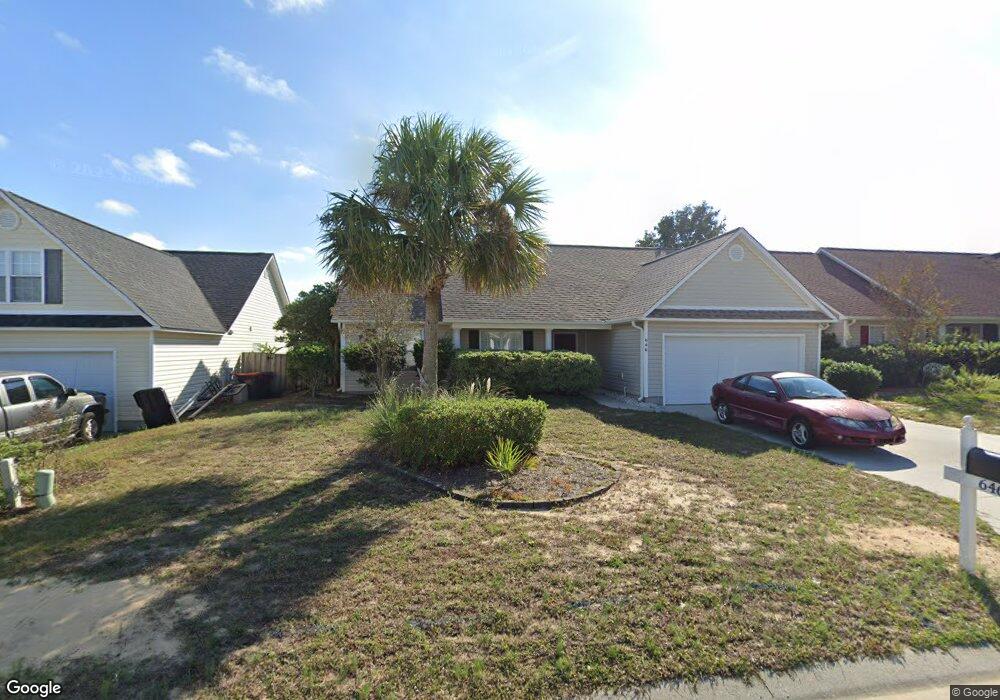
646 Laveen Way Wilmington, NC 28412
Arrondale NeighborhoodEstimated Value: $370,000 - $392,593
3
Beds
2
Baths
1,515
Sq Ft
$254/Sq Ft
Est. Value
About This Home
This home is located at 646 Laveen Way, Wilmington, NC 28412 and is currently estimated at $384,898, approximately $254 per square foot. 646 Laveen Way is a home located in New Hanover County with nearby schools including Edwin A. Anderson Elementary School, Charles P. Murray Middle School, and Eugene Ashley High School.
Ownership History
Date
Name
Owned For
Owner Type
Purchase Details
Closed on
Sep 9, 2009
Sold by
Quigley Sean C
Bought by
Bauer Shawn Wesley and Bauer Theresa Ann
Current Estimated Value
Home Financials for this Owner
Home Financials are based on the most recent Mortgage that was taken out on this home.
Original Mortgage
$100,000
Interest Rate
5.19%
Mortgage Type
New Conventional
Purchase Details
Closed on
Apr 29, 2005
Sold by
Stevens Building Co
Bought by
Quigley Sean C
Home Financials for this Owner
Home Financials are based on the most recent Mortgage that was taken out on this home.
Original Mortgage
$168,978
Interest Rate
5.88%
Mortgage Type
VA
Purchase Details
Closed on
Feb 1, 2005
Sold by
Fogleman Saffo Turner Inc
Bought by
Stevens Building Co
Purchase Details
Closed on
Apr 5, 2000
Sold by
Talman Marion
Bought by
Fogelman Saffo Turner Inc
Create a Home Valuation Report for This Property
The Home Valuation Report is an in-depth analysis detailing your home's value as well as a comparison with similar homes in the area
Home Values in the Area
Average Home Value in this Area
Purchase History
| Date | Buyer | Sale Price | Title Company |
|---|---|---|---|
| Bauer Shawn Wesley | $191,000 | None Available | |
| Quigley Sean C | $169,000 | None Available | |
| Stevens Building Co | $185,000 | None Available | |
| Fogelman Saffo Turner Inc | $706,000 | -- |
Source: Public Records
Mortgage History
| Date | Status | Borrower | Loan Amount |
|---|---|---|---|
| Closed | Bauer Shawn Wesley | $100,000 | |
| Previous Owner | Quigley Sean C | $168,978 |
Source: Public Records
Tax History Compared to Growth
Tax History
| Year | Tax Paid | Tax Assessment Tax Assessment Total Assessment is a certain percentage of the fair market value that is determined by local assessors to be the total taxable value of land and additions on the property. | Land | Improvement |
|---|---|---|---|---|
| 2025 | $1,469 | $368,700 | $108,100 | $260,600 |
| 2023 | $1,378 | $249,700 | $59,400 | $190,300 |
| 2022 | $1,385 | $249,700 | $59,400 | $190,300 |
| 2021 | $1,379 | $249,700 | $59,400 | $190,300 |
| 2020 | $1,200 | $189,700 | $42,400 | $147,300 |
| 2019 | $1,200 | $189,700 | $42,400 | $147,300 |
| 2018 | $1,200 | $189,700 | $42,400 | $147,300 |
| 2017 | $1,228 | $189,700 | $42,400 | $147,300 |
| 2016 | $1,123 | $162,100 | $42,400 | $119,700 |
| 2015 | $1,044 | $162,100 | $42,400 | $119,700 |
| 2014 | $1,026 | $162,100 | $42,400 | $119,700 |
Source: Public Records
Map
Nearby Homes
- 6809 Lipscomb Dr
- 6304 Lenoir Dr
- 213 Santa Ana Dr
- 114 Colquitt Dr
- 100 Rockledge Rd
- 1003 Windgate Dr
- 6617 Sago Palm Dr
- 400 Okeechobee Rd
- 311 Chattooga Place
- 6546 Carolina Beach
- 6556 Carolina Beach
- 105 Helmsman Dr
- 618 Condo Club Dr Unit 308
- 6709 Hailsham Dr
- 112 Pitch Pine Ct
- 645 Condo Club Dr Unit 302
- 123 Bella Port Ln
- 201 Small Dove Ct
- 128 Bella Port Ln
- 6809 Hailsham Dr
- 650 Laveen Way
- 642 Laveen Way
- 654 Laveen Way
- 638 Laveen Way
- 647 Laveen Way
- 651 Laveen Way
- 634 Laveen Way
- 658 Laveen Way
- 643 Laveen Way
- 655 Laveen Way
- 639 Laveen Way
- 659 Laveen Way
- 630 Laveen Way
- 635 Laveen Way
- 646 Castine Way
- 650 Castine Way
- 642 Castine Way
- 654 Castine Way
- 638 Castine Way
- 6429 Kirkwood Dr Unit 318