646 Maple Dr Streamwood, IL 60107
Hanover Park AreaEstimated Value: $408,000 - $576,000
About This Home
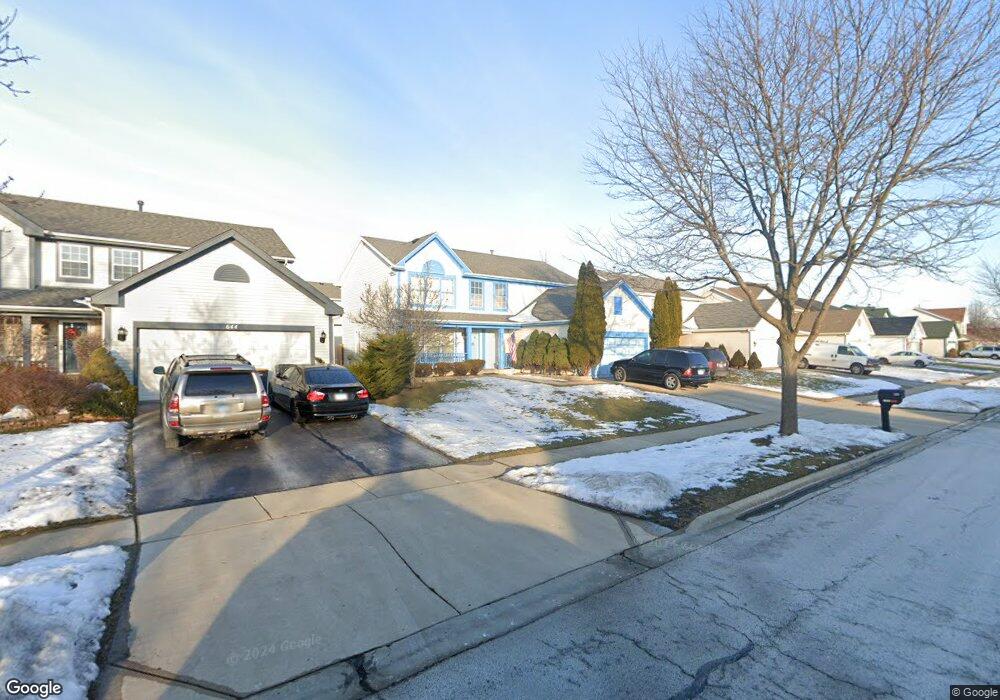
This home is located at 646 Maple Dr, Streamwood, IL 60107 and is currently estimated at $467,193, approximately $224 per square foot. 646 Maple Dr is a home located in Cook County with nearby schools including Heritage Elementary School, Tefft Middle School, and Streamwood High School.
Ownership History
We collect this data history from publicly available records. To have your information removed, we recommend requesting removal directly through your county’s website.
Purchase Details
Purchase Details
Home Values in the Area
Average Home Value in this Area
Purchase History
We collect this data history from publicly available records. To have your information removed, we recommend requesting removal directly through your county’s website.
| Date | Buyer | Sale Price | Title Company |
|---|---|---|---|
| -- | None Listed On Document | ||
| $183,500 | -- |
Tax History
We collect this data history from publicly available records. To have your information removed, we recommend requesting removal directly through your county’s website.
| Year | Tax Paid | Tax Assessment Tax Assessment Total Assessment is a certain percentage of the fair market value that is determined by local assessors to be the total taxable value of land and additions on the property. | Land | Improvement |
|---|---|---|---|---|
| 2025 | -- | $42,000 | $5,136 | $36,864 |
| 2024 | -- | $31,000 | $4,494 | $26,506 |
| 2023 | -- | $31,000 | $4,494 | $26,506 |
| 2022 | $0 | $31,000 | $4,494 | $26,506 |
| 2021 | $4,991 | $20,430 | $3,049 | $17,381 |
| 2020 | $6,248 | $20,430 | $3,049 | $17,381 |
| 2019 | $6,260 | $22,955 | $3,049 | $19,906 |
| 2018 | $6,957 | $23,130 | $2,728 | $20,402 |
| 2017 | $6,882 | $23,130 | $2,728 | $20,402 |
| 2016 | $7,249 | $24,818 | $2,728 | $22,090 |
| 2015 | $7,704 | $24,286 | $2,407 | $21,879 |
| 2014 | $7,606 | $24,286 | $2,407 | $21,879 |
| 2013 | $7,349 | $24,286 | $2,407 | $21,879 |
Map
- 7043 Hemlock St
- 809 Stowell Ave
- 1835 Mckool Ave
- 1611 Moore Ave
- 1623 Mckool Ave
- 2110 Cherry Ave
- 110 N Chase Ave
- 218 N Marion Ave
- 103 Daniel Ct Unit A
- 2027 Walnut Ave
- 157 Peter Ct Unit B
- 219 N Berteau Ave
- 320 Joan Ct Unit D
- 2135 Elm Ave
- 613 Wicker Ave
- 335 David Ct Unit B
- 7341 East Ave
- 4092 Quincy Ct
- 4096 Quincy Ct Unit 3
- 4028 Oxford Ct
Ask me questions while you tour the home.