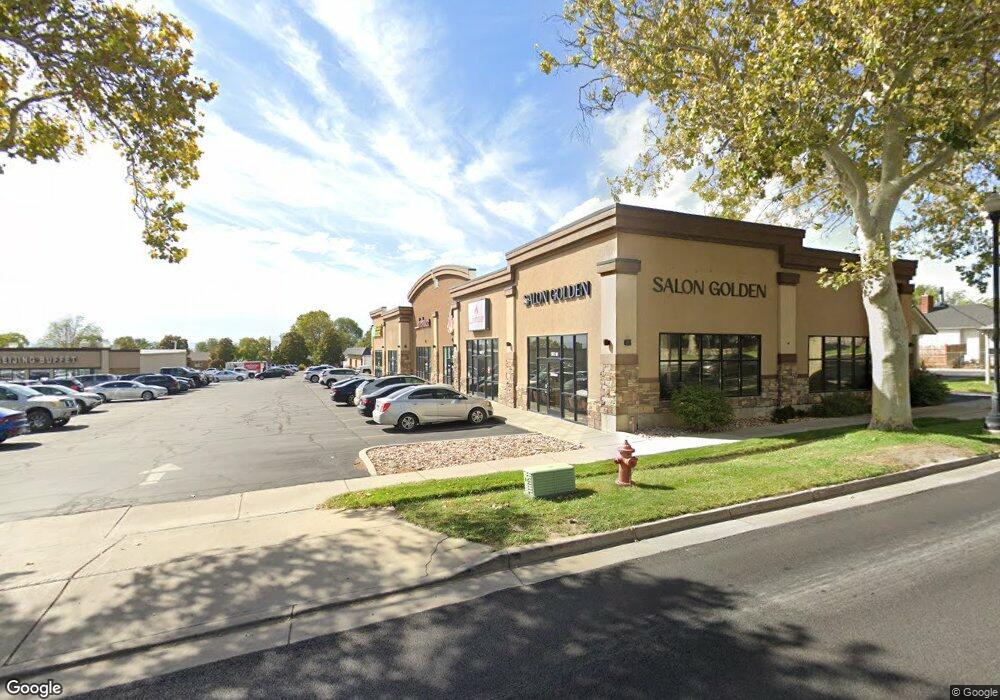
646 S Main St Brigham City, UT 84302
Estimated Value: $914,059 - $1,224,000
--
Bed
--
Bath
6,120
Sq Ft
$179/Sq Ft
Est. Value
About This Home
This home is located at 646 S Main St, Brigham City, UT 84302 and is currently estimated at $1,095,020, approximately $178 per square foot. 646 S Main St is a home located in Box Elder County with nearby schools including Lake View Elementary School, Adele C. Young Intermediate School, and Box Elder Middle School.
Ownership History
Date
Name
Owned For
Owner Type
Purchase Details
Closed on
Dec 10, 2019
Sold by
Cvc Properties Llc
Bought by
Young Victoria L and Young Chad B
Current Estimated Value
Home Financials for this Owner
Home Financials are based on the most recent Mortgage that was taken out on this home.
Original Mortgage
$350,000
Outstanding Balance
$309,178
Interest Rate
3.7%
Mortgage Type
New Conventional
Estimated Equity
$785,842
Purchase Details
Closed on
Jan 3, 2016
Sold by
Christensen Marie D
Bought by
Ed And Marie Christensen Family Trust
Create a Home Valuation Report for This Property
The Home Valuation Report is an in-depth analysis detailing your home's value as well as a comparison with similar homes in the area
Home Values in the Area
Average Home Value in this Area
Purchase History
| Date | Buyer | Sale Price | Title Company |
|---|---|---|---|
| Young Victoria L | -- | Hickman Land Title Logan | |
| Ed And Marie Christensen Family Trust | -- | None Available |
Source: Public Records
Mortgage History
| Date | Status | Borrower | Loan Amount |
|---|---|---|---|
| Open | Young Victoria L | $350,000 |
Source: Public Records
Tax History Compared to Growth
Tax History
| Year | Tax Paid | Tax Assessment Tax Assessment Total Assessment is a certain percentage of the fair market value that is determined by local assessors to be the total taxable value of land and additions on the property. | Land | Improvement |
|---|---|---|---|---|
| 2025 | $4,675 | $900,000 | $78,408 | $821,592 |
| 2024 | $4,675 | $900,000 | $78,408 | $821,592 |
| 2023 | $4,566 | $900,000 | $78,408 | $821,592 |
| 2022 | $3,242 | $594,000 | $40,000 | $554,000 |
| 2021 | $3,560 | $432,000 | $40,000 | $392,000 |
| 2020 | $2,659 | $432,000 | $40,000 | $392,000 |
| 2019 | $2,748 | $237,600 | $22,000 | $215,600 |
| 2018 | $2,764 | $237,600 | $237,600 | $0 |
| 2017 | $2,064 | $307,230 | $168,977 | $0 |
| 2016 | $2,245 | $168,977 | $8,140 | $160,837 |
| 2015 | $2,332 | $168,977 | $8,140 | $160,837 |
| 2014 | $2,332 | $168,977 | $8,140 | $160,837 |
| 2013 | -- | $168,977 | $8,140 | $160,837 |
Source: Public Records
Map
Nearby Homes