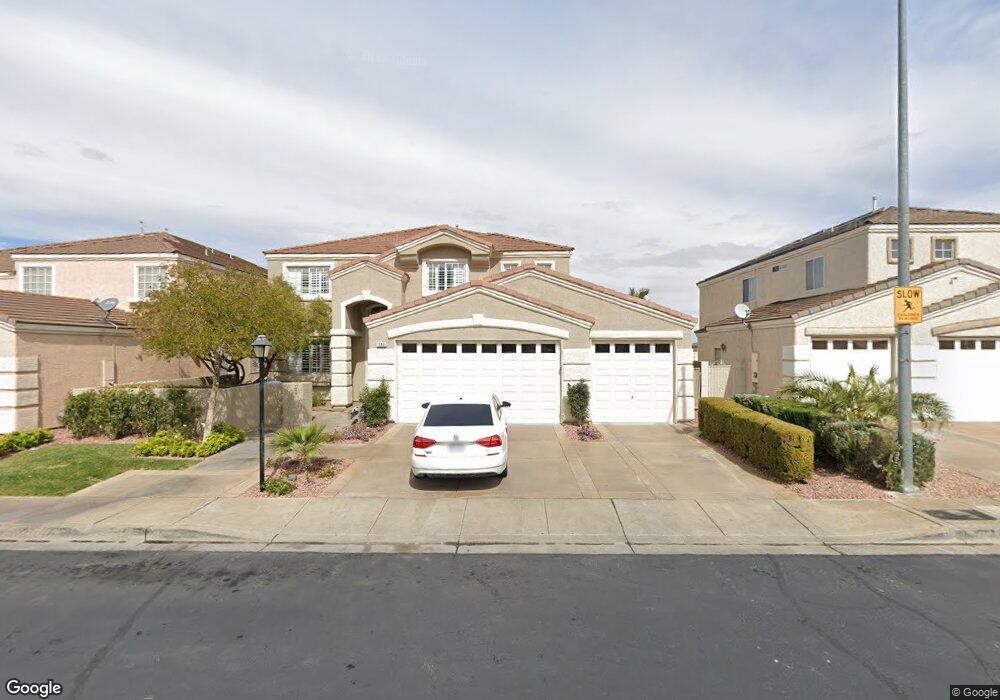
646 Tyler Ridge Ave Henderson, NV 89012
McCullough Hills NeighborhoodEstimated Value: $559,000 - $587,000
5
Beds
4
Baths
3,043
Sq Ft
$190/Sq Ft
Est. Value
About This Home
This home is located at 646 Tyler Ridge Ave, Henderson, NV 89012 and is currently estimated at $578,414, approximately $190 per square foot. 646 Tyler Ridge Ave is a home located in Clark County with nearby schools including Ulis Newton Elementary School, Jack & Terry Mannion Middle School, and Foothill High School.
Ownership History
Date
Name
Owned For
Owner Type
Purchase Details
Closed on
May 25, 2017
Sold by
Thomson Jeffery R and Thomson Jamie D
Bought by
Thomson Jeffrey R and Thomson Jamie D
Current Estimated Value
Home Financials for this Owner
Home Financials are based on the most recent Mortgage that was taken out on this home.
Original Mortgage
$255,000
Outstanding Balance
$132,119
Interest Rate
3.97%
Mortgage Type
New Conventional
Estimated Equity
$446,295
Purchase Details
Closed on
Oct 16, 2003
Sold by
Thomson Jeffery R and Thomson Jamie D
Bought by
Thomson Jeffery R and Thomson Jamie D
Purchase Details
Closed on
Oct 30, 2002
Sold by
Rbc Mtg Company
Bought by
Thomson Jeffery R and Thomson Jamie D
Home Financials for this Owner
Home Financials are based on the most recent Mortgage that was taken out on this home.
Original Mortgage
$169,735
Interest Rate
5.99%
Create a Home Valuation Report for This Property
The Home Valuation Report is an in-depth analysis detailing your home's value as well as a comparison with similar homes in the area
Home Values in the Area
Average Home Value in this Area
Purchase History
| Date | Buyer | Sale Price | Title Company |
|---|---|---|---|
| Thomson Jeffrey R | -- | Equity Title Of Nevada | |
| Thomson Jeffery R | -- | -- | |
| Thomson Jeffery R | $170,700 | Stewart Title |
Source: Public Records
Mortgage History
| Date | Status | Borrower | Loan Amount |
|---|---|---|---|
| Open | Thomson Jeffrey R | $255,000 | |
| Closed | Thomson Jeffery R | $169,735 |
Source: Public Records
Tax History Compared to Growth
Tax History
| Year | Tax Paid | Tax Assessment Tax Assessment Total Assessment is a certain percentage of the fair market value that is determined by local assessors to be the total taxable value of land and additions on the property. | Land | Improvement |
|---|---|---|---|---|
| 2025 | $2,676 | $155,268 | $42,350 | $112,918 |
| 2024 | $2,599 | $155,268 | $42,350 | $112,918 |
| 2023 | $2,121 | $143,093 | $36,050 | $107,043 |
| 2022 | $2,523 | $129,052 | $31,500 | $97,552 |
| 2021 | $2,450 | $121,191 | $28,350 | $92,841 |
| 2020 | $2,376 | $119,287 | $27,300 | $91,987 |
| 2019 | $2,307 | $114,438 | $23,800 | $90,638 |
| 2018 | $2,239 | $107,455 | $20,650 | $86,805 |
| 2017 | $3,063 | $105,654 | $17,500 | $88,154 |
| 2016 | $2,121 | $101,299 | $15,400 | $85,899 |
| 2015 | $2,115 | $77,565 | $11,900 | $65,665 |
| 2014 | $2,053 | $68,814 | $8,750 | $60,064 |
Source: Public Records
Map
Nearby Homes
- 136 Camino Francisco
- 669 Pacific Cascades Dr
- 624 Tyler Ridge Ave
- 668 Pacific Cascades Dr
- 727 Camino la Paz
- 138 Camino Capri
- 197 Kings Canyon Ct
- 105 Richland Hills Ave
- 636 Pacific Cascades Dr
- 196 Mount Earl Ave
- 99 Milicity Rd
- 739 Solitude Point Ave
- 93 Autumn Day St
- 228 Serenity Crest St
- 230 Serenity Crest St Unit 2
- 39 La Laguna St Unit 1
- 100 Misty Rain St
- 727 Florence Isle Ave
- 707 Value Ridge Ave
- 221 Errogie St
- 648 Tyler Ridge Ave
- 644 Tyler Ridge Ave
- 787 Camino Del Ray
- 650 Tyler Ridge Ave
- 642 Tyler Ridge Ave
- 791 Camino Del Ray
- 783 Camino Del Ray
- 164 Arches Ct
- 649 Tyler Ridge Ave
- 791 Camino la Paz
- 795 Camino la Paz
- 652 Tyler Ridge Ave
- 779 Camino Del Ray Unit 3
- 166 Arches Ct
- 795 Camino Del Ray Unit 3
- 651 Tyler Ridge Ave
- 163 Gannett Peak St
- 775 Camino Del Ray
- 799 Camino la Paz
- 799 Camino la Paz Unit n/a