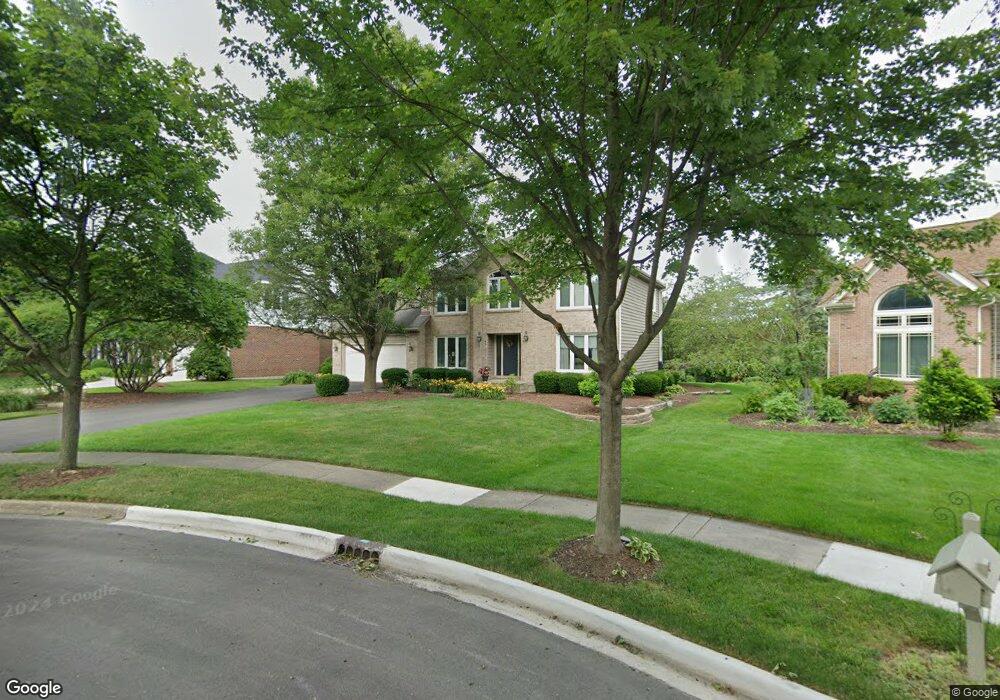
6461 Bobby Jones Ln Woodridge, IL 60517
Seven Bridges NeighborhoodEstimated Value: $790,741 - $884,000
4
Beds
3
Baths
2,721
Sq Ft
$304/Sq Ft
Est. Value
About This Home
This home is located at 6461 Bobby Jones Ln, Woodridge, IL 60517 and is currently estimated at $827,685, approximately $304 per square foot. 6461 Bobby Jones Ln is a home located in DuPage County with nearby schools including Meadow Glens Elementary School, Kennedy Junior High School, and Naperville North High School.
Ownership History
Date
Name
Owned For
Owner Type
Purchase Details
Closed on
Jul 18, 2005
Sold by
Foley John P and Carfagna Foley Carol H
Bought by
Klippenstein Stephen J and Klippenstein Gloria E
Current Estimated Value
Home Financials for this Owner
Home Financials are based on the most recent Mortgage that was taken out on this home.
Original Mortgage
$468,000
Outstanding Balance
$245,090
Interest Rate
5.71%
Mortgage Type
Fannie Mae Freddie Mac
Estimated Equity
$582,595
Purchase Details
Closed on
Feb 7, 2002
Sold by
Sherman Dawn A
Bought by
Foley John P and Carfagna Foley Carol H
Home Financials for this Owner
Home Financials are based on the most recent Mortgage that was taken out on this home.
Original Mortgage
$380,000
Interest Rate
7.24%
Purchase Details
Closed on
Feb 23, 1995
Sold by
Neukranz Richard K
Bought by
Sherman Dawn A
Purchase Details
Closed on
Dec 10, 1993
Sold by
Naperville Westbank
Bought by
Neukranz Richard K and Sherman Dawn A
Home Financials for this Owner
Home Financials are based on the most recent Mortgage that was taken out on this home.
Original Mortgage
$235,000
Interest Rate
7.15%
Create a Home Valuation Report for This Property
The Home Valuation Report is an in-depth analysis detailing your home's value as well as a comparison with similar homes in the area
Home Values in the Area
Average Home Value in this Area
Purchase History
| Date | Buyer | Sale Price | Title Company |
|---|---|---|---|
| Klippenstein Stephen J | $585,000 | Premier Title | |
| Foley John P | $475,000 | -- | |
| Sherman Dawn A | -- | -- | |
| Neukranz Richard K | $298,000 | -- |
Source: Public Records
Mortgage History
| Date | Status | Borrower | Loan Amount |
|---|---|---|---|
| Open | Klippenstein Stephen J | $468,000 | |
| Previous Owner | Foley John P | $380,000 | |
| Previous Owner | Neukranz Richard K | $235,000 |
Source: Public Records
Tax History Compared to Growth
Tax History
| Year | Tax Paid | Tax Assessment Tax Assessment Total Assessment is a certain percentage of the fair market value that is determined by local assessors to be the total taxable value of land and additions on the property. | Land | Improvement |
|---|---|---|---|---|
| 2024 | $13,457 | $197,971 | $86,812 | $111,159 |
| 2023 | $12,929 | $180,680 | $79,230 | $101,450 |
| 2022 | $12,986 | $180,680 | $79,230 | $101,450 |
| 2021 | $12,440 | $173,840 | $76,230 | $97,610 |
| 2020 | $12,194 | $170,720 | $74,860 | $95,860 |
| 2019 | $11,844 | $163,330 | $71,620 | $91,710 |
| 2018 | $12,491 | $171,020 | $74,990 | $96,030 |
| 2017 | $12,281 | $165,250 | $72,460 | $92,790 |
| 2016 | $12,042 | $159,280 | $69,840 | $89,440 |
| 2015 | $11,936 | $150,000 | $65,770 | $84,230 |
| 2014 | $11,963 | $147,060 | $64,480 | $82,580 |
| 2013 | $11,862 | $147,410 | $64,630 | $82,780 |
Source: Public Records
Map
Nearby Homes
- 6524 Greene Rd
- 6441 Bobby Jones Ln Unit 2
- 6420 Double Eagle Dr Unit E35
- 6420 Double Eagle Dr Unit 610
- 6420 Double Eagle Dr Unit 510
- 23W501 Green Trails Dr
- 3550 Irving Place
- 3570 Sawgrass Dr
- 3573 Mulligan Dr
- 17 Mashie Ct
- 7S610 Lynn Dr
- Willwood Plan at Rivers Edge - Estates
- Riverton Plan at Rivers Edge - Estates
- Maple Valley Plan at Rivers Edge - Estates
- Woodside Plan at Rivers Edge - Estates
- Westchester Plan at Rivers Edge - Estates
- Castleton Plan at Rivers Edge - Estates
- Deer Valley Plan at Rivers Edge - Estates
- 1856 Carriage Hill Rd
- 6255 Sandbelt Dr Unit 36003
- 6457 Bobby Jones Ln
- 6465 Bobby Jones Ln
- 6453 Bobby Jones Ln
- 6468 Bobby Jones Ln
- 6473 Bobby Jones Ln
- 6449 Bobby Jones Ln
- 6456 Bobby Jones Ln
- 6472 Bobby Jones Ln
- 6477 Bobby Jones Ln
- 6445 Bobby Jones Ln
- 6448 Bobby Jones Ln
- 6476 Bobby Jones Ln
- 3813 Patty Berg Ct Unit 2
- 3817 Patty Berg Ct
- 6481 Bobby Jones Ln Unit 2
- 6521 Greene Rd
- 3821 Patty Berg Ct
- 6529 Greene Rd
- 6440 Bobby Jones Ln
- 6437 Bobby Jones Ln Unit 2