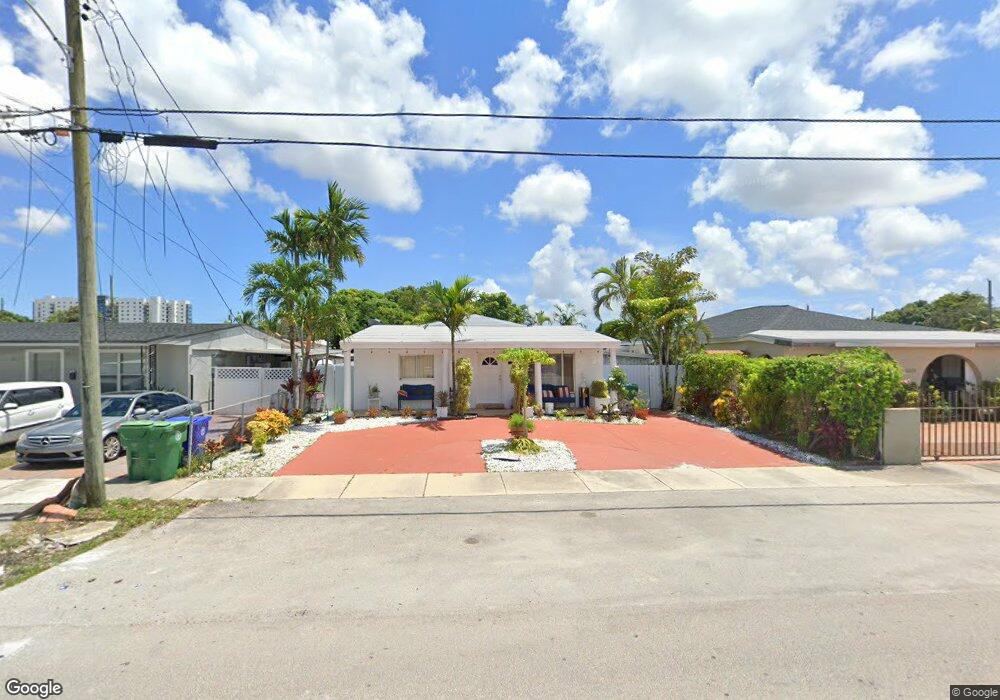
6462 SW 4th St Miami, FL 33144
Flagami NeighborhoodEstimated Value: $602,000 - $627,000
2
Beds
2
Baths
1,632
Sq Ft
$378/Sq Ft
Est. Value
About This Home
This home is located at 6462 SW 4th St, Miami, FL 33144 and is currently estimated at $617,582, approximately $378 per square foot. 6462 SW 4th St is a home located in Miami-Dade County with nearby schools including Fairlawn Elementary School, Kinloch Park Middle School, and South Miami Senior High School.
Ownership History
Date
Name
Owned For
Owner Type
Purchase Details
Closed on
Apr 13, 2017
Sold by
Sainz Miriam M and Reyes Walter Enrique
Bought by
Sainz Miriam M and Reyes Walter Enrique
Current Estimated Value
Purchase Details
Closed on
Jun 29, 2005
Sold by
Sosa Sulema and Duque Dora Sosa
Bought by
Sainz Aristedes and Sainz Mirian M
Home Financials for this Owner
Home Financials are based on the most recent Mortgage that was taken out on this home.
Original Mortgage
$270,750
Outstanding Balance
$143,247
Interest Rate
5.87%
Mortgage Type
New Conventional
Estimated Equity
$474,335
Purchase Details
Closed on
May 6, 2004
Sold by
Sosa Sulema
Bought by
Sosa Sulema and Duque Dora Sosa
Purchase Details
Closed on
Dec 22, 2003
Sold by
Quintero Jorge Enrique
Bought by
Sosa Sulema
Home Financials for this Owner
Home Financials are based on the most recent Mortgage that was taken out on this home.
Original Mortgage
$147,250
Interest Rate
3.5%
Mortgage Type
Unknown
Create a Home Valuation Report for This Property
The Home Valuation Report is an in-depth analysis detailing your home's value as well as a comparison with similar homes in the area
Home Values in the Area
Average Home Value in this Area
Purchase History
| Date | Buyer | Sale Price | Title Company |
|---|---|---|---|
| Sainz Miriam M | -- | Attorney | |
| Sainz Aristedes | $285,000 | -- | |
| Sosa Sulema | -- | -- | |
| Sosa Sulema | $155,000 | -- |
Source: Public Records
Mortgage History
| Date | Status | Borrower | Loan Amount |
|---|---|---|---|
| Open | Sainz Aristedes | $270,750 | |
| Previous Owner | Sosa Sulema | $147,250 |
Source: Public Records
Tax History
| Year | Tax Paid | Tax Assessment Tax Assessment Total Assessment is a certain percentage of the fair market value that is determined by local assessors to be the total taxable value of land and additions on the property. | Land | Improvement |
|---|---|---|---|---|
| 2025 | $3,365 | $196,273 | -- | -- |
| 2024 | $3,326 | $190,742 | -- | -- |
| 2023 | $3,326 | $185,187 | $0 | $0 |
| 2022 | $3,220 | $179,794 | $0 | $0 |
| 2021 | $3,202 | $174,558 | $0 | $0 |
| 2020 | $3,160 | $172,148 | $0 | $0 |
| 2019 | $3,084 | $168,278 | $0 | $0 |
| 2018 | $2,960 | $165,141 | $0 | $0 |
| 2017 | $2,922 | $161,745 | $0 | $0 |
| 2016 | $2,929 | $158,419 | $0 | $0 |
| 2015 | $2,957 | $157,318 | $0 | $0 |
| 2014 | $2,985 | $156,070 | $0 | $0 |
Source: Public Records
Map
Nearby Homes
- 6460 SW 2nd St
- 444 SW 64th Ave
- 635 SW 64th Ct
- 6580 W Flagler St Unit 309
- 35 SW 63rd Ct
- 634 SW 63rd Ave
- 6261 SW 6th St
- 6820 W Flagler St Unit 207
- 6820 W Flagler St Unit 101
- 6820 W Flagler St Unit 405
- 6437 SW 10th St
- 40 NW 62nd Ave
- 250 NW 63rd Ct
- 6476 SW 10th Terrace
- 6337 SW 11th St
- 243 NW 62nd Ct
- 1000 SW 62nd Ave
- 231 NW 62nd Ave
- 300 SW 71st Ave
- 6091 SW 12th St
- 6480 SW 4th St
- 6452 SW 4th St
- 6490 SW 4th St
- 6450 SW 4th St
- 425 SW 65th Ave
- 435 SW 65th Ave
- 434 SW 64th Ct
- 6471 SW 4th St
- 445 SW 65th Ave
- 6461 SW 4th St
- 6481 SW 4th St
- 444 SW 64th Ct
- 6451 SW 4th St
- 6491 SW 4th St
- 6440 SW 4th St
- 6500 SW 4th St
- 451 SW 65th Ave
- 454 SW 64th Ct
- 6430 SW 4th St
- 424 SW 65th Ave
Your Personal Tour Guide
Ask me questions while you tour the home.