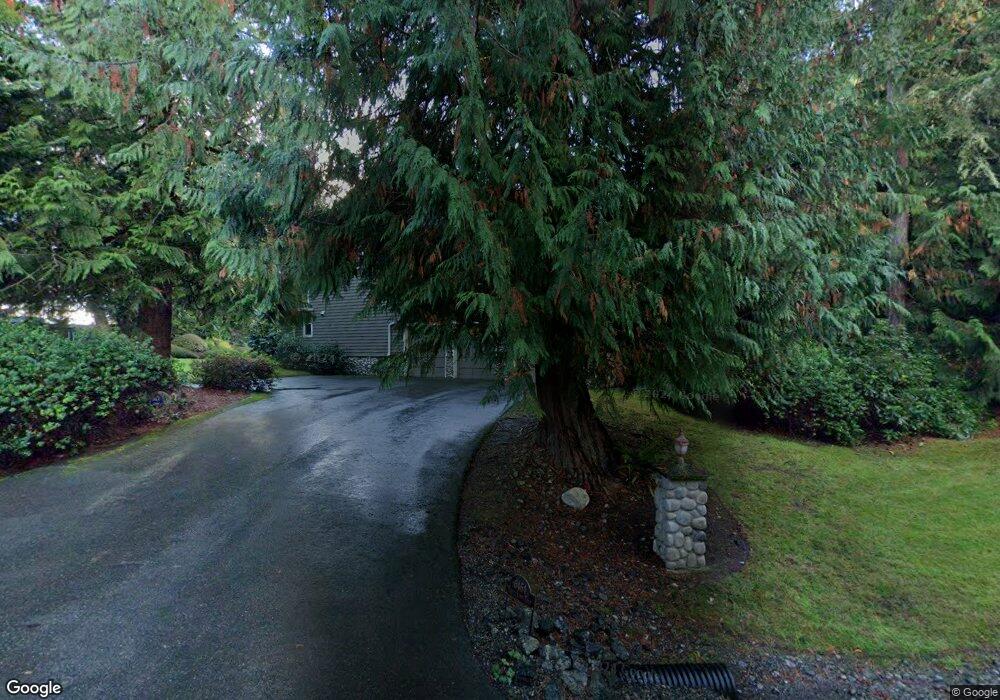
6464 Haley Loop Rd NE Bainbridge Island, WA 98110
Estimated Value: $1,859,993 - $2,035,000
4
Beds
3
Baths
4,050
Sq Ft
$480/Sq Ft
Est. Value
About This Home
This home is located at 6464 Haley Loop Rd NE, Bainbridge Island, WA 98110 and is currently estimated at $1,945,498, approximately $480 per square foot. 6464 Haley Loop Rd NE is a home located in Kitsap County with nearby schools including Bainbridge High School, Montessori Country School, and Madrona School.
Ownership History
Date
Name
Owned For
Owner Type
Purchase Details
Closed on
Sep 23, 2008
Sold by
Renkes Gregg D and Renkes Maureen K
Bought by
Spigal Jerauld and Spigal Judith
Current Estimated Value
Purchase Details
Closed on
Feb 16, 2005
Sold by
Gourley John Britton and Gourley Nancy L
Bought by
Renkes Gregg D and Renkes Maureen K
Home Financials for this Owner
Home Financials are based on the most recent Mortgage that was taken out on this home.
Original Mortgage
$615,000
Interest Rate
1%
Mortgage Type
Purchase Money Mortgage
Purchase Details
Closed on
Feb 20, 2002
Sold by
James Heggenstaller Construction Inc
Bought by
Gourley John Britton and Gourley Nancy L
Home Financials for this Owner
Home Financials are based on the most recent Mortgage that was taken out on this home.
Original Mortgage
$300,000
Interest Rate
6.12%
Purchase Details
Closed on
Mar 19, 2001
Sold by
Stetson Development Co Llc
Bought by
James Heggenstaller Construction Inc
Home Financials for this Owner
Home Financials are based on the most recent Mortgage that was taken out on this home.
Original Mortgage
$576,000
Interest Rate
7.11%
Create a Home Valuation Report for This Property
The Home Valuation Report is an in-depth analysis detailing your home's value as well as a comparison with similar homes in the area
Home Values in the Area
Average Home Value in this Area
Purchase History
| Date | Buyer | Sale Price | Title Company |
|---|---|---|---|
| Spigal Jerauld | $955,280 | Pacific Nw Title | |
| Renkes Gregg D | $820,000 | Pacific Nw Title | |
| Gourley John Britton | $652,000 | Pacific Nw Title | |
| James Heggenstaller Construction Inc | $145,000 | Pacific Nw Title |
Source: Public Records
Mortgage History
| Date | Status | Borrower | Loan Amount |
|---|---|---|---|
| Previous Owner | Renkes Gregg D | $615,000 | |
| Previous Owner | Gourley John Britton | $300,000 | |
| Previous Owner | James Heggenstaller Construction Inc | $576,000 |
Source: Public Records
Tax History Compared to Growth
Tax History
| Year | Tax Paid | Tax Assessment Tax Assessment Total Assessment is a certain percentage of the fair market value that is determined by local assessors to be the total taxable value of land and additions on the property. | Land | Improvement |
|---|---|---|---|---|
| 2026 | $12,857 | $1,601,080 | $264,800 | $1,336,280 |
| 2025 | $12,857 | $1,601,080 | $264,800 | $1,336,280 |
| 2024 | $12,286 | $1,601,080 | $264,800 | $1,336,280 |
| 2023 | $12,829 | $1,601,080 | $264,800 | $1,336,280 |
| 2022 | $10,775 | $1,142,870 | $175,170 | $967,700 |
| 2021 | $11,026 | $1,116,060 | $170,780 | $945,280 |
| 2020 | $11,177 | $1,116,060 | $170,780 | $945,280 |
| 2019 | $9,979 | $1,015,090 | $155,370 | $859,720 |
| 2018 | $10,166 | $883,850 | $135,160 | $748,690 |
| 2017 | $9,155 | $883,850 | $135,160 | $748,690 |
| 2016 | $8,824 | $808,590 | $135,160 | $673,430 |
| 2015 | $7,726 | $721,210 | $135,160 | $586,050 |
| 2014 | -- | $646,310 | $135,160 | $511,150 |
| 2013 | -- | $646,310 | $135,160 | $511,150 |
Source: Public Records
Map
Nearby Homes
- 6465 Haley Loop Rd NE
- 7559 Cornerstone Ln NE Unit 1-4
- 8277 New Holland Ct NE
- 7698 Westerly Ln NE
- 23 Beargrass Ln NE
- 5755 Blakely Ave NE
- 8128 High School Loop NE
- 1240 Weaver Rd NW Unit B1
- 144 Hall Brothers Loop NW Unit 101
- 214 Shepard Way NW
- 230 Canopy Path NW
- 392 Wills Ln NW
- 224 Canopy Path NW
- 204 Shepard Way NW
- 200 Shepard Way NW
- 259 Shepard Way NW Unit 204
- 141 Parfitt Way SW Unit A-35
- 141 Parfitt Way SW Unit M-10
- 9418 NE Tidal Ct
- 8679 NE Fox Den Ln Unit Lot B
- 6452 Haley Loop Rd NE
- 6476 Haley Loop Rd NE
- 6457 Haley Loop Rd NE
- 6555 Ridge Ln NE
- 6448 Haley Loop Rd NE
- 6443 Haley Loop Rd NE
- 0 Lot 2 Ridge Ln NE
- 0 LOT 3 Ridge Ln NE
- 655 Ridge Ln NE
- 6473 Haley Loop Rd NE Unit Lot15
- 6473 Haley Loop Rd NE
- 6541 Ridge Ln NE
- 6481 Haley Loop Rd NE
- 6440 Haley Loop Rd NE
- 7805 Ledge Stone Loop NE Unit 1
- 7744 NE Adria Ln
- 6437 Haley Loop Rd NE
- 7741 NE Adria Ln
- 0 4 Lots Haley Loop Rd NE
- 0 Lot D Haley Loop Rd NE