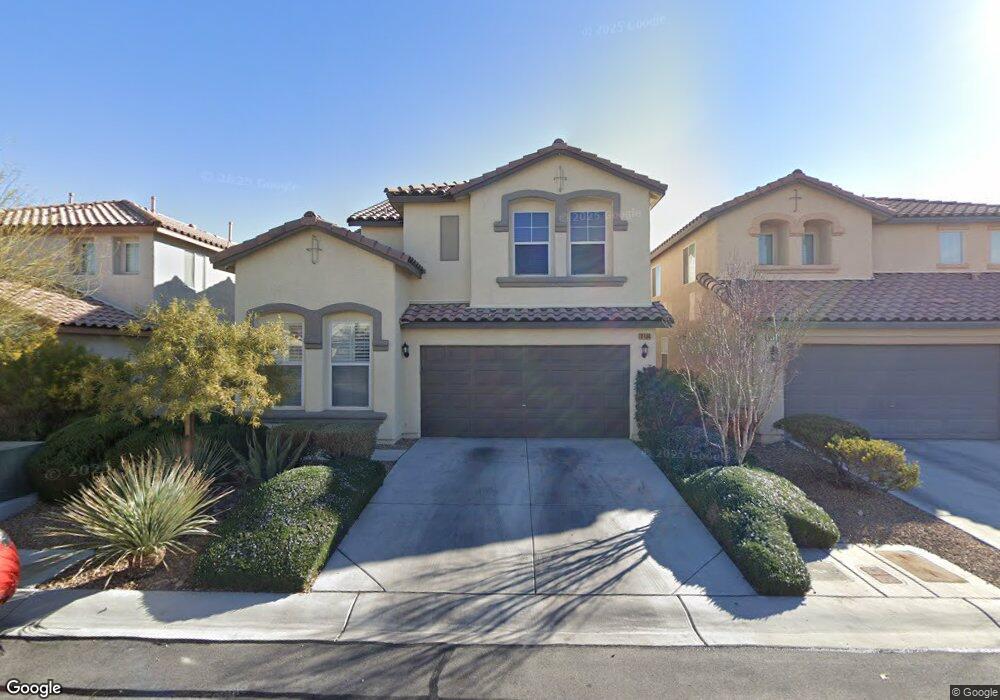
6464 Sean Creek St Las Vegas, NV 89149
Estimated Value: $424,842 - $478,000
4
Beds
3
Baths
1,988
Sq Ft
$227/Sq Ft
Est. Value
About This Home
This home is located at 6464 Sean Creek St, Las Vegas, NV 89149 and is currently estimated at $451,211, approximately $226 per square foot. 6464 Sean Creek St is a home located in Clark County with nearby schools including Marshall C. Darnell Elementary School, Edmundo "Eddie" Escobedo, Sr. Middle School, and Centennial High School.
Ownership History
Date
Name
Owned For
Owner Type
Purchase Details
Closed on
May 16, 2016
Sold by
Yoown Josie
Bought by
Covel Josephine A
Current Estimated Value
Purchase Details
Closed on
Nov 2, 2011
Sold by
Ralyea Charles James and Emsley Melissa A
Bought by
Ralyea Charles James
Purchase Details
Closed on
Sep 24, 2008
Sold by
Jones Judith
Bought by
Ralyea Charles James and Emsley Melissa A
Home Financials for this Owner
Home Financials are based on the most recent Mortgage that was taken out on this home.
Original Mortgage
$210,429
Interest Rate
6.31%
Mortgage Type
VA
Purchase Details
Closed on
Mar 30, 2006
Sold by
Richmond American Homes Of Nevada Inc
Bought by
Jones Judith
Home Financials for this Owner
Home Financials are based on the most recent Mortgage that was taken out on this home.
Original Mortgage
$247,800
Interest Rate
6.5%
Mortgage Type
New Conventional
Create a Home Valuation Report for This Property
The Home Valuation Report is an in-depth analysis detailing your home's value as well as a comparison with similar homes in the area
Home Values in the Area
Average Home Value in this Area
Purchase History
| Date | Buyer | Sale Price | Title Company |
|---|---|---|---|
| Covel Josephine A | -- | None Available | |
| Ralyea Charles James | -- | None Available | |
| Ralyea Charles James | $215,500 | Titleone Of Las Vegas | |
| Jones Judith | $312,726 | Stewart Title Of Nevada |
Source: Public Records
Mortgage History
| Date | Status | Borrower | Loan Amount |
|---|---|---|---|
| Previous Owner | Ralyea Charles James | $210,429 | |
| Previous Owner | Jones Judith | $247,800 |
Source: Public Records
Tax History Compared to Growth
Tax History
| Year | Tax Paid | Tax Assessment Tax Assessment Total Assessment is a certain percentage of the fair market value that is determined by local assessors to be the total taxable value of land and additions on the property. | Land | Improvement |
|---|---|---|---|---|
| 2025 | $1,677 | $119,533 | $33,600 | $85,933 |
| 2024 | $1,629 | $119,533 | $33,600 | $85,933 |
| 2023 | $1,629 | $113,971 | $32,900 | $81,071 |
| 2022 | $1,734 | $100,483 | $26,600 | $73,883 |
| 2021 | $1,606 | $94,677 | $24,500 | $70,177 |
| 2020 | $1,488 | $93,911 | $24,500 | $69,411 |
| 2019 | $1,395 | $88,262 | $20,300 | $67,962 |
| 2018 | $1,289 | $80,046 | $16,450 | $63,596 |
| 2017 | $1,989 | $72,963 | $15,050 | $57,913 |
| 2016 | $1,376 | $58,353 | $11,550 | $46,803 |
| 2015 | $1,452 | $44,856 | $7,000 | $37,856 |
| 2014 | $1,484 | $41,819 | $5,250 | $36,569 |
Source: Public Records
Map
Nearby Homes
- 6324 Zephyr Peak Ct
- 6348 Zephyr Peak Ct
- 6312 Zephyr Peak Ct
- 0 N Miller Unit 2686157
- 5889 N Shaumber Rd
- 0 Tropical Pkwy Unit 2720666
- 0 N Miller Unit 2686151
- 8888 Steven Chase Ct
- 6617 Breakwater Reef St
- 8925 Silent Brook Ct
- 6619 Salt Pond Bay St
- 6315 N El Capitan Way
- 6630 Rocky Reef St
- 5975 N El Capitan Way
- 6230 Calm Brook Ct
- 6196 Serenity Bluffs St
- 6749 Browns Bay Ct
- 0 Durango and Centennial
- 0 Azure & Campbell Unit 2736259
- 9148 Patrick Henry Ave
- 6470 Sean Creek St
- 6458 Sean Creek St
- 8970 Candice Creek Ct
- 6476 Sean Creek St Unit n/a
- 6476 Sean Creek St
- 6452 Sean Creek St
- 8967 Ryan Creek Ave
- 8964 Candice Creek Ct
- 5490 Grambley St
- 9930 O Loughlin Manor Ave
- 9910 Justin Earl Ave
- 9910 O Loughlin Manor Ave
- 9915 Justin Earl Ave
- 5450 Grambley St
- 9995 Justin Earl Ave
- 5430 Grambley St
- 5410 Grambley St
- 9955 Justin Earl Ave
- 5415 Grambley St
- 5475 Grambley St