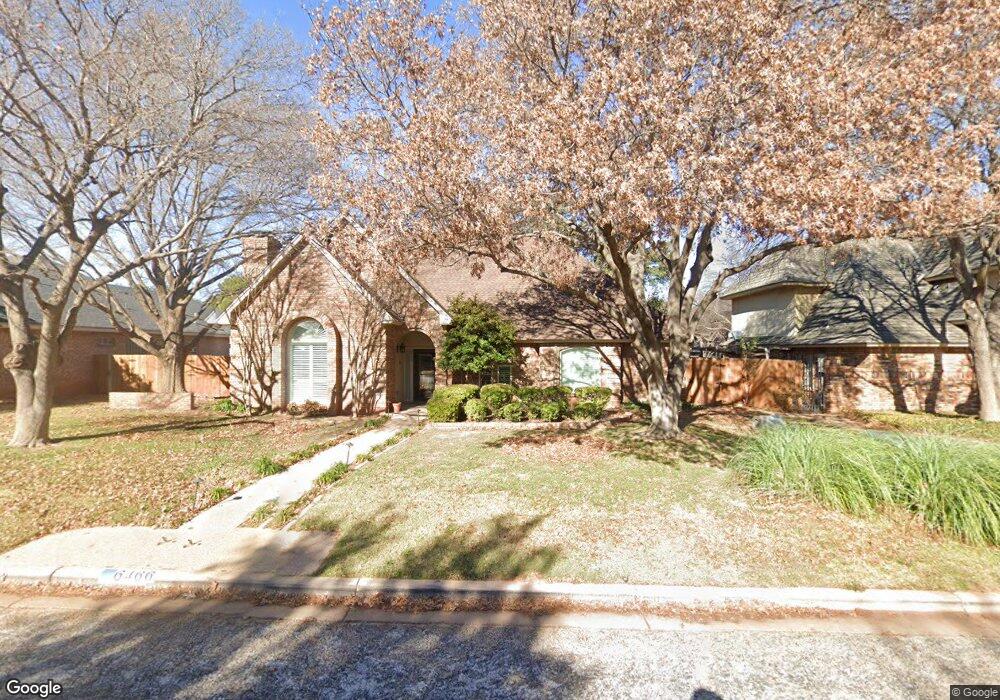
6466 Bay Hill Dr Abilene, TX 79606
Far Southside NeighborhoodEstimated Value: $344,865 - $379,000
3
Beds
2
Baths
2,371
Sq Ft
$152/Sq Ft
Est. Value
About This Home
This home is located at 6466 Bay Hill Dr, Abilene, TX 79606 and is currently estimated at $361,466, approximately $152 per square foot. 6466 Bay Hill Dr is a home located in Taylor County with nearby schools including Wylie West Early Childhood Center, Wylie West Elementary School, and Wylie West Intermediate School.
Ownership History
Date
Name
Owned For
Owner Type
Purchase Details
Closed on
Jul 5, 2017
Sold by
Cockerell Phillip M and Cockerell Floradean
Bought by
Alderman Billie W
Current Estimated Value
Purchase Details
Closed on
Sep 29, 2011
Sold by
King John D
Bought by
Cockerell Phillip M and Cockerell Floradean
Home Financials for this Owner
Home Financials are based on the most recent Mortgage that was taken out on this home.
Original Mortgage
$135,000
Interest Rate
4.28%
Mortgage Type
New Conventional
Purchase Details
Closed on
May 18, 2006
Sold by
Jones Stanley Keith and Jones Loretta A
Bought by
King John D and Underwood King Patsy L
Purchase Details
Closed on
Apr 29, 2005
Sold by
Alexandra & John William Inc
Bought by
Jones Loretta A
Home Financials for this Owner
Home Financials are based on the most recent Mortgage that was taken out on this home.
Original Mortgage
$31,600
Interest Rate
6.06%
Mortgage Type
Purchase Money Mortgage
Create a Home Valuation Report for This Property
The Home Valuation Report is an in-depth analysis detailing your home's value as well as a comparison with similar homes in the area
Home Values in the Area
Average Home Value in this Area
Purchase History
| Date | Buyer | Sale Price | Title Company |
|---|---|---|---|
| Alderman Billie W | -- | None Available | |
| Cockerell Phillip M | -- | None Available | |
| King John D | -- | None Available | |
| Jones Loretta A | -- | None Available |
Source: Public Records
Mortgage History
| Date | Status | Borrower | Loan Amount |
|---|---|---|---|
| Previous Owner | Cockerell Phillip M | $135,000 | |
| Previous Owner | Jones Loretta A | $31,600 |
Source: Public Records
Tax History Compared to Growth
Tax History
| Year | Tax Paid | Tax Assessment Tax Assessment Total Assessment is a certain percentage of the fair market value that is determined by local assessors to be the total taxable value of land and additions on the property. | Land | Improvement |
|---|---|---|---|---|
| 2025 | $2,658 | $340,381 | $24,886 | $315,495 |
| 2023 | $2,658 | $296,111 | $0 | $0 |
| 2022 | $6,352 | $269,192 | $0 | $0 |
| 2021 | $6,304 | $244,720 | $22,220 | $222,500 |
| 2020 | $6,185 | $236,202 | $22,220 | $213,982 |
| 2019 | $6,222 | $230,916 | $22,220 | $208,696 |
| 2018 | $5,789 | $231,248 | $22,220 | $209,028 |
| 2017 | $5,457 | $226,277 | $22,220 | $204,057 |
| 2016 | $5,130 | $212,746 | $22,220 | $190,526 |
| 2015 | $4,122 | $211,621 | $22,220 | $189,401 |
| 2014 | $4,122 | $200,836 | $0 | $0 |
Source: Public Records
Map
Nearby Homes
- 23 Mesa Ridge
- 3550 Balboa Beach
- TBD Phoenix Dr
- 18 Mission Hills
- 11 Monarch Dr
- 8 Contour Dr
- 6851 Glen Abbey St
- 6850 Glen Abbey St
- 6434 Glen Abbey St
- 6717 Hillside Ct
- 4034 Forrest Hill Rd
- 3676 Yamini Dr
- 3425 Front Nine Dr
- 3441 Torrey Pine
- 3333 Torrey Pine
- 6249 Bay Hill Dr
- 6781 Hillside Ct
- 6947 Forrest Meadows Dr
- 3325 Ace
- 3342 Front Nine Rd
- 3918 Bay Hill Dr
- 6458 Bay Hill Dr
- 6449 Inverrary Dr
- 3926 Bay Hill Dr
- 6450 Bay Hill Dr
- 6441 Inverrary Dr
- 6465 Bay Hill Dr
- 6457 Bay Hill Dr
- 3901 Bay Hill Dr
- 3909 Inverrary Dr
- 3934 Bay Hill Dr
- 6442 Bay Hill Dr
- 6433 Inverrary Dr
- 6449 Bay Hill Dr
- 3909 Bay Hill Dr
- 3917 Inverrary Dr
- 6434 Inverrary Dr
- 3942 Bay Hill Dr
- 3902 Inverrary Dr
- 6441 Bay Hill Dr