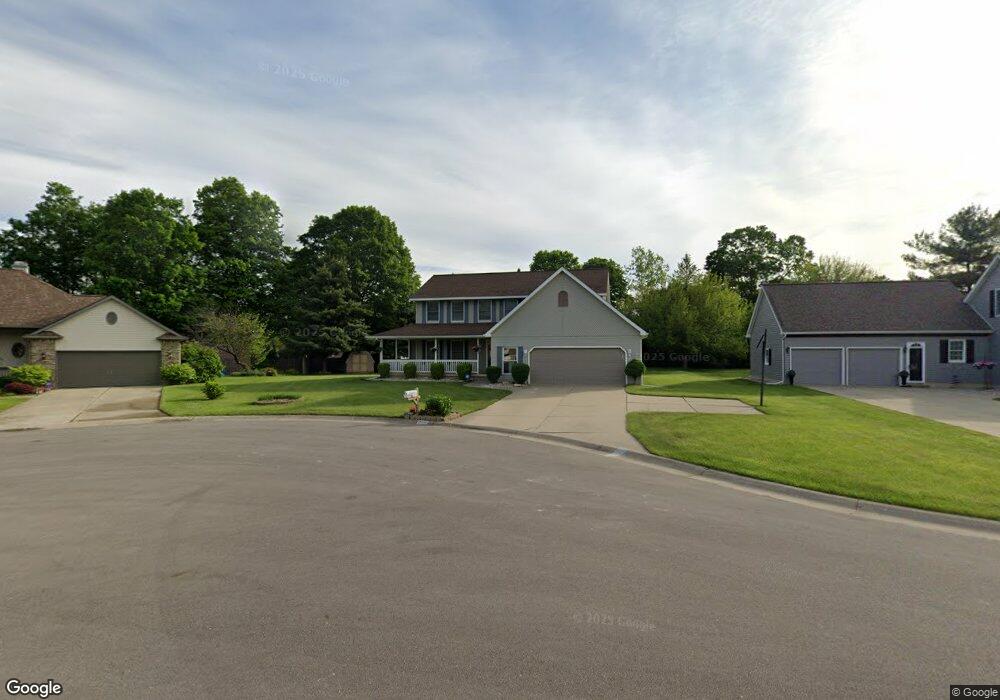
6466 Flagstone Ct Flushing, MI 48433
Estimated Value: $303,887 - $373,000
4
Beds
3
Baths
2,028
Sq Ft
$172/Sq Ft
Est. Value
About This Home
This home is located at 6466 Flagstone Ct, Flushing, MI 48433 and is currently estimated at $348,472, approximately $171 per square foot. 6466 Flagstone Ct is a home located in Genesee County with nearby schools including Springview Elementary School, Flushing Middle School, and Flushing High School.
Ownership History
Date
Name
Owned For
Owner Type
Purchase Details
Closed on
Feb 6, 2006
Sold by
Nguyen Evon and Dang Tam Anh
Bought by
Dang Tam Anh and Tran Tuyet Thi
Current Estimated Value
Home Financials for this Owner
Home Financials are based on the most recent Mortgage that was taken out on this home.
Original Mortgage
$140,000
Interest Rate
6.3%
Mortgage Type
New Conventional
Purchase Details
Closed on
Oct 28, 2005
Sold by
Nguyen Evon
Bought by
Nguyen Evon and Dang Tam Anh
Purchase Details
Closed on
May 11, 2004
Sold by
Chadwick Roger L and Chadwick Karen M
Bought by
Nguyen Evon
Purchase Details
Closed on
May 19, 2000
Sold by
Chadwick Roger L and Chadwick Karen M
Bought by
Chadwick Roger L and Chadwick Karen M
Purchase Details
Closed on
Jan 19, 1999
Sold by
Tallman Anthony S and Tallman Mary B
Bought by
Chadwick Roger L and Chadwick Karen M
Create a Home Valuation Report for This Property
The Home Valuation Report is an in-depth analysis detailing your home's value as well as a comparison with similar homes in the area
Home Values in the Area
Average Home Value in this Area
Purchase History
| Date | Buyer | Sale Price | Title Company |
|---|---|---|---|
| Dang Tam Anh | -- | Metro Title Corporation | |
| Nguyen Evon | -- | None Available | |
| Nguyen Evon | -- | None Available | |
| Nguyen Evon | $253,000 | First American Title | |
| Chadwick Roger L | -- | First American Title | |
| Chadwick Roger L | -- | -- | |
| Chadwick Roger L | $249,000 | Cislo Title Company |
Source: Public Records
Mortgage History
| Date | Status | Borrower | Loan Amount |
|---|---|---|---|
| Closed | Dang Tam Anh | $140,000 |
Source: Public Records
Tax History
| Year | Tax Paid | Tax Assessment Tax Assessment Total Assessment is a certain percentage of the fair market value that is determined by local assessors to be the total taxable value of land and additions on the property. | Land | Improvement |
|---|---|---|---|---|
| 2025 | $3,775 | $140,000 | $0 | $0 |
| 2024 | $1,994 | $136,400 | $0 | $0 |
| 2023 | $1,903 | $128,500 | $0 | $0 |
| 2022 | $1,613 | $109,600 | $0 | $0 |
| 2021 | $3,372 | $105,200 | $0 | $0 |
| 2020 | $1,783 | $105,200 | $0 | $0 |
| 2019 | $1,766 | $97,900 | $0 | $0 |
| 2018 | $3,141 | $90,100 | $0 | $0 |
| 2017 | $2,917 | $90,100 | $0 | $0 |
| 2016 | $2,934 | $88,600 | $0 | $0 |
| 2015 | $2,735 | $85,600 | $0 | $0 |
| 2014 | $1,553 | $82,000 | $0 | $0 |
| 2012 | -- | $69,800 | $69,800 | $0 |
Source: Public Records
Map
Nearby Homes
- 6551 River Rd
- 2365 Flagstone Dr
- 6268 Boulder Dr
- 6273 Boulder Dr
- 2291 Woods Dr W
- 74 Emeraldwood Trail
- 60 Emeraldwood Trail
- 00 Emeraldwood Trail
- 7105 Woods Dr W
- 7095 Woods West Dr Unit 4
- 7040 Cambridge Dr
- 7042 Cambridge Dr
- 7049 Cambridge Dr
- 7040 Kings Way
- 6123 E River Rd
- 7044 Cambridge Dr
- 7048 Cambridge Dr
- 7050 Cambridge Dr
- 7053 Cambridge Dr
- 7055 Cambridge Dr
- 6462 Flagstone Ct
- 6470 Flagstone Ct
- 6535 River Rd
- 6458 Flagstone Ct
- 6473 Flagstone Ct
- 6465 Flagstone Ct
- 6469 Flagstone Ct
- 6461 Flagstone Ct
- 6454 Flagstone Ct
- 6551 River Rd
- 6457 Flagstone Ct
- 6494 River Rd
- 6522 River Rd
- 6464 Marble Ln
- 6468 Marble Ln
- 6460 Marble Ln
- 6484 River Rd
- 6565 River Rd
- 6450 Flagstone Ct
- 18035 Flagstone Ct
Your Personal Tour Guide
Ask me questions while you tour the home.