Estimated Value: $373,873 - $418,000
3
Beds
3
Baths
2,104
Sq Ft
$188/Sq Ft
Est. Value
About This Home
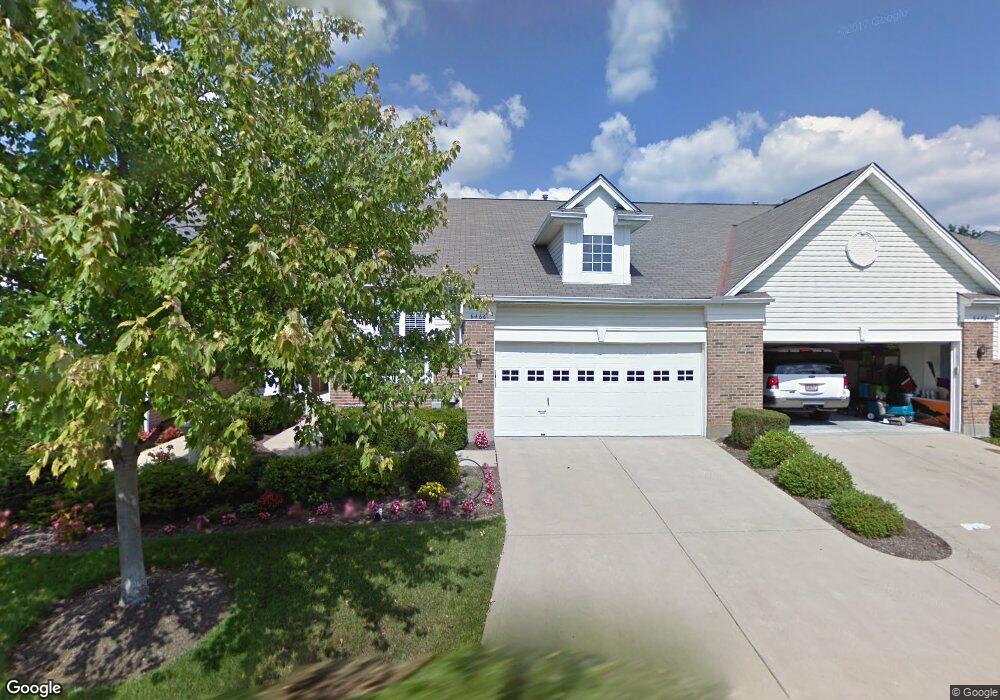
This home is located at 6466 Turtle Point Place, Mason, OH 45040 and is currently estimated at $395,718, approximately $188 per square foot. 6466 Turtle Point Place is a home located in Warren County with nearby schools including Kings Junior High School, Kings High School, and Mars Hill Academy.
Ownership History
Date
Name
Owned For
Owner Type
Purchase Details
Closed on
Jan 25, 2019
Sold by
Quallen Paul V and Quallen Robbin P
Bought by
Peery Pamela A
Current Estimated Value
Purchase Details
Closed on
Jan 24, 2019
Sold by
Quallen John T
Bought by
Peery Pamela A
Purchase Details
Closed on
Jan 23, 2019
Sold by
Ellis Thomas A
Bought by
Peery Pamela A
Purchase Details
Closed on
Jan 18, 2019
Sold by
Peery Pamela A and Helen M Quallen Living Trust
Bought by
Quallen Paul V and Peery Pamela A
Purchase Details
Closed on
Aug 22, 2008
Sold by
Jonas Laurie G
Bought by
Peery Pam A and James C Perry & Pamela A Perry Trust
Purchase Details
Closed on
Oct 22, 2003
Sold by
Gardner Todd and Gardner Elva M
Bought by
Jonas Laurie G
Home Financials for this Owner
Home Financials are based on the most recent Mortgage that was taken out on this home.
Original Mortgage
$136,000
Interest Rate
6.04%
Mortgage Type
Purchase Money Mortgage
Purchase Details
Closed on
Jul 3, 1996
Sold by
Ryland Group Inc
Bought by
Todd and Todd Elva Gardner
Create a Home Valuation Report for This Property
The Home Valuation Report is an in-depth analysis detailing your home's value as well as a comparison with similar homes in the area
Home Values in the Area
Average Home Value in this Area
Purchase History
| Date | Buyer | Sale Price | Title Company |
|---|---|---|---|
| Peery Pamela A | -- | None Available | |
| Peery Pamela A | -- | None Available | |
| Peery Pamela A | -- | None Available | |
| Quallen Paul V | -- | None Available | |
| Peery Pam A | $195,000 | Prodigy Title | |
| Jonas Laurie G | $170,000 | Advanced Land Title | |
| Todd | $190,925 | -- |
Source: Public Records
Mortgage History
| Date | Status | Borrower | Loan Amount |
|---|---|---|---|
| Previous Owner | Jonas Laurie G | $136,000 |
Source: Public Records
Tax History Compared to Growth
Tax History
| Year | Tax Paid | Tax Assessment Tax Assessment Total Assessment is a certain percentage of the fair market value that is determined by local assessors to be the total taxable value of land and additions on the property. | Land | Improvement |
|---|---|---|---|---|
| 2024 | $5,130 | $113,100 | $42,350 | $70,750 |
| 2023 | $3,994 | $82,866 | $22,715 | $60,151 |
| 2022 | $3,947 | $82,866 | $22,715 | $60,151 |
| 2021 | $3,261 | $82,866 | $22,715 | $60,151 |
| 2020 | $3,186 | $70,224 | $19,250 | $50,974 |
| 2019 | $3,230 | $70,224 | $19,250 | $50,974 |
| 2018 | $3,237 | $70,224 | $19,250 | $50,974 |
| 2017 | $3,030 | $60,501 | $16,828 | $43,673 |
| 2016 | $3,113 | $60,501 | $16,828 | $43,673 |
| 2015 | $2,804 | $60,501 | $16,828 | $43,673 |
| 2014 | $2,725 | $56,540 | $15,730 | $40,820 |
| 2013 | $2,729 | $69,210 | $19,250 | $49,960 |
Source: Public Records
Map
Nearby Homes
- 6572 Eagle View Dr
- 6441 Eagleview Dr
- 6534 Turtle Point Place
- 6415 Eagleview Dr
- 6394 Grand Cypress Way
- 6486 Prestwick Ct
- 6416 Inverness Way
- 6309 Inverness Way
- 6521 Grand Cypress Way
- 711 Eagle View Ct
- 3900 St Andrews Ct
- 618 Bunker Ln
- 5799 Fairway Dr
- 4087 Fieldsedge Dr Unit 285E
- 550 Maple Ln
- 4154 Fieldsedge Dr
- 6668 Pondfield Ln
- 400 Walnut Ln
- 4109 Old Manchester Ct
- 5895 Springview Cir
- 6462 Turtle Point Place
- 6472 Turtle Point Place
- 6484 Turtle Point Place
- 6456 Turtle Point Place
- 6560 Eagleview Dr
- 6488 Turtle Point Place
- 6377 Pinehurst Ln
- 6566 Eagle View Dr
- 6494 Turtle Point Place
- 6444 Eagle View Dr
- 6385 Pinehurst Ln
- 6572 Eagleview Dr
- 6389 Pinehurst Ln
- 6440 Eagleview Dr
- 6445 Eagleview Dr
- 6500 Turtle Point Place
- 6576 Eagleview Dr
- 6441 Eagle View Dr
- 6395 Pinehurst Ln
- 6434 Eagleview Dr