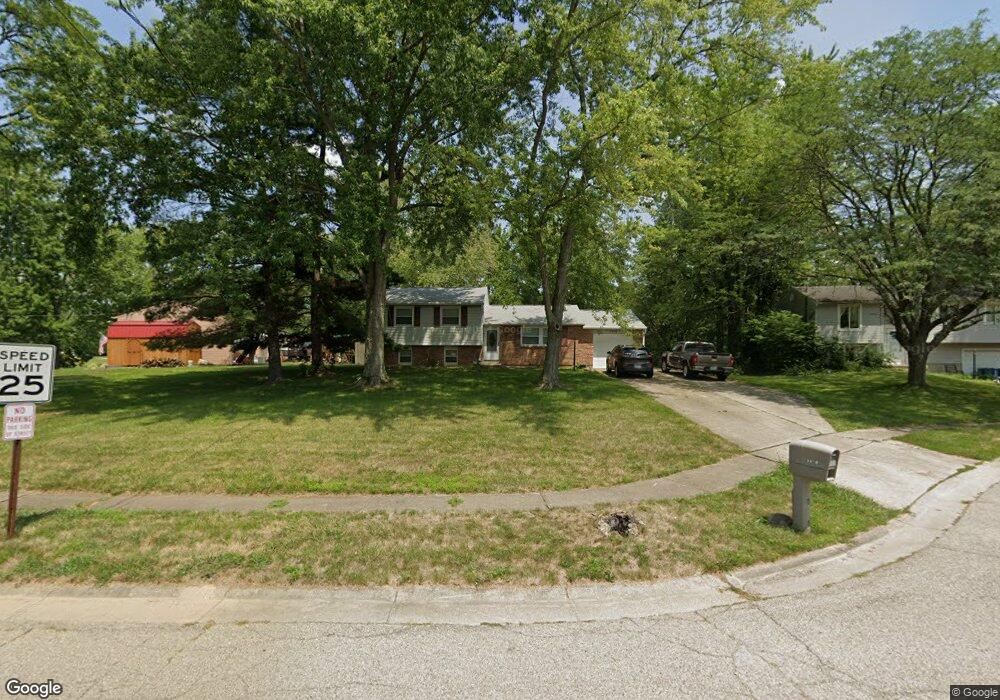
6468 Gingham Rd Loveland, OH 45140
Estimated Value: $237,000 - $269,000
3
Beds
2
Baths
1,040
Sq Ft
$246/Sq Ft
Est. Value
About This Home
This home is located at 6468 Gingham Rd, Loveland, OH 45140 and is currently estimated at $256,027, approximately $246 per square foot. 6468 Gingham Rd is a home located in Clermont County with nearby schools including Marr/Cook Elementary School, Spaulding Elementary School, and Goshen Middle School.
Ownership History
Date
Name
Owned For
Owner Type
Purchase Details
Closed on
Jun 28, 1993
Current Estimated Value
Create a Home Valuation Report for This Property
The Home Valuation Report is an in-depth analysis detailing your home's value as well as a comparison with similar homes in the area
Home Values in the Area
Average Home Value in this Area
Purchase History
| Date | Buyer | Sale Price | Title Company |
|---|---|---|---|
| -- | $77,000 | -- |
Source: Public Records
Tax History Compared to Growth
Tax History
| Year | Tax Paid | Tax Assessment Tax Assessment Total Assessment is a certain percentage of the fair market value that is determined by local assessors to be the total taxable value of land and additions on the property. | Land | Improvement |
|---|---|---|---|---|
| 2024 | $3,352 | $72,420 | $13,200 | $59,220 |
| 2023 | $3,231 | $72,420 | $13,200 | $59,220 |
| 2022 | $2,340 | $46,060 | $8,400 | $37,660 |
| 2021 | $2,354 | $46,060 | $8,400 | $37,660 |
| 2020 | $2,204 | $46,060 | $8,400 | $37,660 |
| 2019 | $2,138 | $42,880 | $10,750 | $32,130 |
| 2018 | $2,149 | $42,880 | $10,750 | $32,130 |
| 2017 | $1,917 | $42,880 | $10,750 | $32,130 |
| 2016 | $1,946 | $36,330 | $9,100 | $27,230 |
| 2015 | $1,735 | $36,330 | $9,100 | $27,230 |
| 2014 | $1,735 | $36,330 | $9,100 | $27,230 |
| 2013 | $1,614 | $35,210 | $9,100 | $26,110 |
Source: Public Records
Map
Nearby Homes
- 1019 Canterbury Ln
- 2066 Cameron Crossing
- 3009 Abby Way
- 6442 Charles Snider Rd
- 5934 Marsh Cir
- 5997 Marsh Cir
- 5718 Clemens Dr
- 411 Catrina Ct
- 374a Redbird Dr
- VENTURA Plan at Villages of Belmont
- CALABASAS II Plan at Villages of Belmont
- 6590 Oakland Rd
- 5047 Charles Snider Rd
- 1786 Broadstone Cir
- Birch with Full Basement Plan at Barclay Woods
- Elder with Full Basement Plan at Barclay Woods
- Cedar with Full Basement Plan at Barclay Woods
- Tupelo with Full Basement Plan at Barclay Woods
- Aspen with Full Basement Plan at Barclay Woods
- 5099 Charles Snider Rd
- 6466 E Gingham Rd
- 6476 Gingham Rd
- 6476 E Gingham Rd
- 6466 Gingham Rd
- 6478 Gingham Rd
- 6464 Gingham Rd
- 6480 Gingham Rd
- 6465 Gingham Rd
- 6471 Gingham Rd
- 6469 Gingham Rd
- 6469 Gingham Rd
- 6477 E Gingham Rd
- 6477 Gingham Rd
- 6467 Gingham Rd
- 6465 Gingham Rd
- 6473 Gingham Rd
- 6475 Gingham Rd
- 6482 Gingham Rd
- 6494 Springhouse Ave
- 6483 Gingham Rd