6469 Arbor Gate Dr SW Mableton, GA 30126
Estimated Value: $189,000 - $216,000
2
Beds
3
Baths
1,380
Sq Ft
$151/Sq Ft
Est. Value
About This Home
This home is located at 6469 Arbor Gate Dr SW, Mableton, GA 30126 and is currently estimated at $208,043, approximately $150 per square foot. 6469 Arbor Gate Dr SW is a home located in Cobb County with nearby schools including Clay-Harmony Leland Elementary School, Lindley Middle School, and Pebblebrook High School.
Ownership History
Date
Name
Owned For
Owner Type
Purchase Details
Closed on
Oct 12, 2023
Sold by
Brown Janice L
Bought by
Bedford Blaire A
Current Estimated Value
Home Financials for this Owner
Home Financials are based on the most recent Mortgage that was taken out on this home.
Original Mortgage
$202,500
Outstanding Balance
$198,379
Interest Rate
7.18%
Mortgage Type
New Conventional
Estimated Equity
$9,664
Purchase Details
Closed on
Apr 4, 2018
Sold by
Carter
Bought by
Brown Janice L
Home Financials for this Owner
Home Financials are based on the most recent Mortgage that was taken out on this home.
Original Mortgage
$75,600
Interest Rate
4.46%
Mortgage Type
New Conventional
Purchase Details
Closed on
Oct 29, 2002
Sold by
Centex Homes
Bought by
Carter Evelyn
Home Financials for this Owner
Home Financials are based on the most recent Mortgage that was taken out on this home.
Original Mortgage
$100,128
Interest Rate
5.93%
Mortgage Type
FHA
Create a Home Valuation Report for This Property
The Home Valuation Report is an in-depth analysis detailing your home's value as well as a comparison with similar homes in the area
Home Values in the Area
Average Home Value in this Area
Purchase History
| Date | Buyer | Sale Price | Title Company |
|---|---|---|---|
| Bedford Blaire A | $225,000 | Pacific One Title | |
| Brown Janice L | $84,000 | -- | |
| Carter Evelyn | $103,300 | -- |
Source: Public Records
Mortgage History
| Date | Status | Borrower | Loan Amount |
|---|---|---|---|
| Open | Bedford Blaire A | $202,500 | |
| Previous Owner | Brown Janice L | $75,600 | |
| Previous Owner | Carter Evelyn | $100,128 |
Source: Public Records
Tax History Compared to Growth
Tax History
| Year | Tax Paid | Tax Assessment Tax Assessment Total Assessment is a certain percentage of the fair market value that is determined by local assessors to be the total taxable value of land and additions on the property. | Land | Improvement |
|---|---|---|---|---|
| 2025 | $2,680 | $88,960 | $18,000 | $70,960 |
| 2024 | $2,682 | $88,960 | $18,000 | $70,960 |
| 2023 | $233 | $81,056 | $14,000 | $67,056 |
| 2022 | $381 | $61,504 | $12,000 | $49,504 |
| 2021 | $344 | $49,148 | $9,200 | $39,948 |
| 2020 | $344 | $49,148 | $9,200 | $39,948 |
| 2019 | $288 | $33,600 | $5,240 | $28,360 |
| 2018 | $313 | $34,688 | $6,800 | $27,888 |
| 2017 | $254 | $32,668 | $6,000 | $26,668 |
| 2016 | $149 | $21,868 | $3,200 | $18,668 |
| 2015 | $159 | $21,868 | $3,200 | $18,668 |
| 2014 | $98 | $15,960 | $0 | $0 |
Source: Public Records
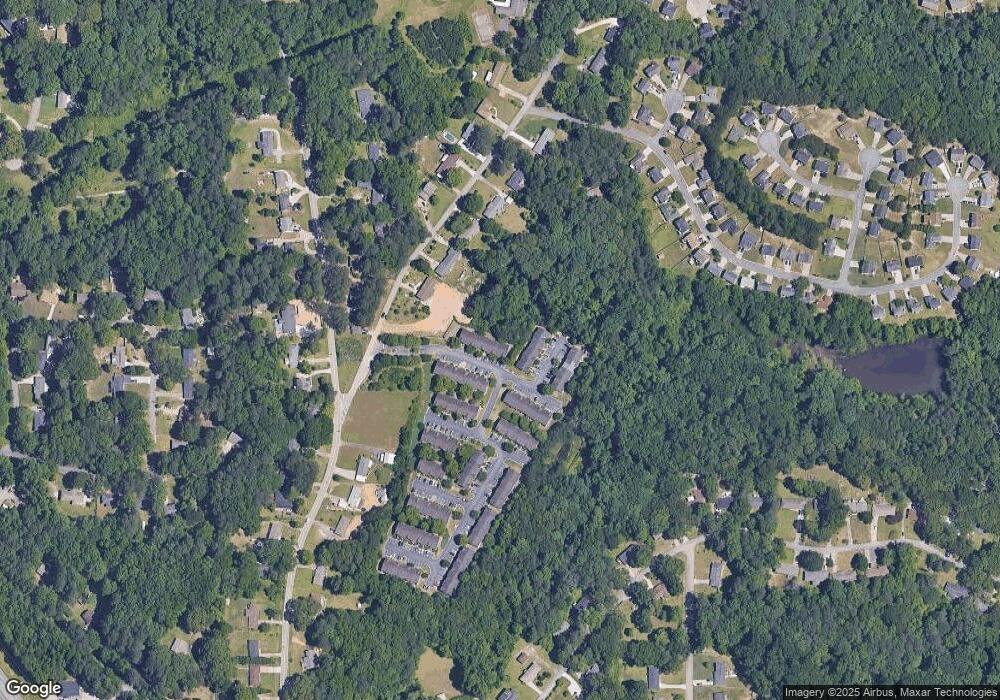
Map
Nearby Homes
- 000 Arbor Gate Dr SW
- 6531 Arbor Gate Dr SW Unit 12
- 6361 Dodgen Rd SW
- 6500 Dodgen Rd SW
- 6286 Allen Rd SW
- 20 Hidden Ct SE
- 123 Matson Run SW Unit 31
- 6215 Dodgen Rd SW
- 261 Stroud Dr SE
- 221 Matson Run SW Unit 40
- 6264 Godfrey Dr SW
- 6692 Armonia Dr
- 6696 Armonia Dr
- 6714 Armonia Dr
- 6722 Armonia Dr
- 6305 Mountain Home Way SE
- Foxglove Plan at Leydenview
- Marigold Plan at Leydenview
- 6321 Mountain Home Way SE
- 224 Kinship Dr
- 6467 Arbor Gate Dr SW Unit 16
- 6467 Arbor Gate Dr SW
- 6467 Arbor Gate Dr SW Unit N/A
- 6467 Arbor Gate Dr SW
- 6469 Arbor Gate Dr SW Unit 16
- 6465 Arbor Gate Dr SW Unit 6465
- 6465 Arbor Gate Dr SW
- 6471 Arbor Gate Dr SW Unit 16
- 6463 Arbor Gate Dr SW Unit 16
- 6461 Arbor Gate Dr SW Unit 122
- 6461 Arbor Gate Dr SW Unit 16
- 6459 Arbor Gate Dr SW
- 6457 Arbor Gate Dr SW Unit 16
- 6457 Arbor Gate Dr SW
- 6457 Arbor Gate Dr SW Unit 124
- 6455 Arbor Gate Dr SW Unit 16
- 6455 Arbor Gate Dr SW Unit 125
- 6475 Arbor Gate Dr SW Unit 15
- 6473 Arbor Gate Dr SW Unit 15
- 6477 Arbor Gate Dr SW Unit 15