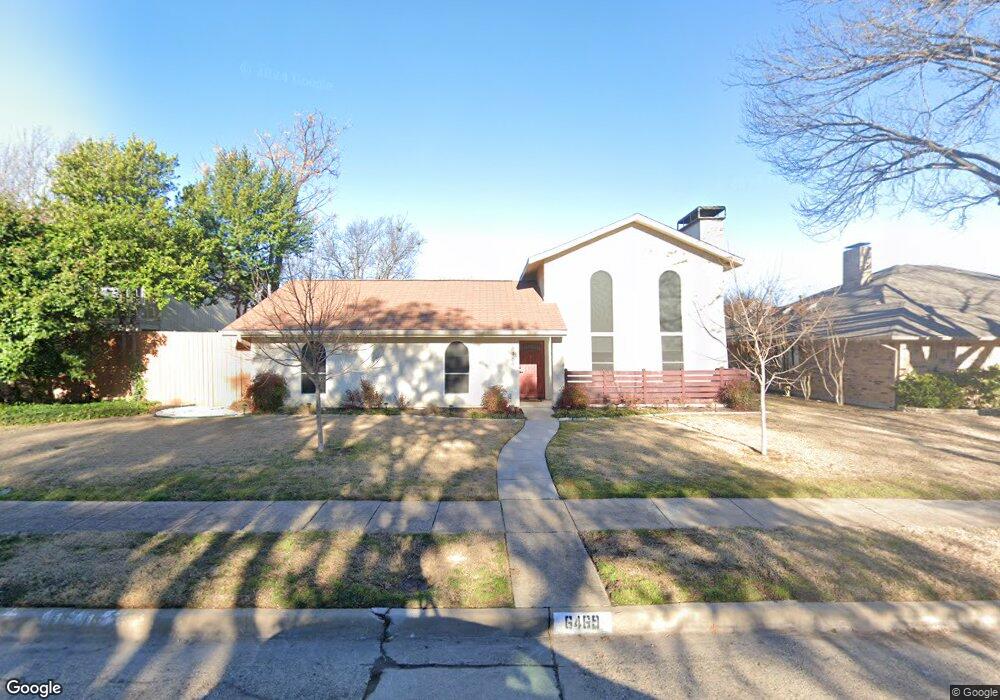
6469 Ridgemont Dr Dallas, TX 75214
Northeast Dallas NeighborhoodEstimated Value: $581,000 - $704,000
3
Beds
3
Baths
1,602
Sq Ft
$398/Sq Ft
Est. Value
About This Home
This home is located at 6469 Ridgemont Dr, Dallas, TX 75214 and is currently estimated at $637,840, approximately $398 per square foot. 6469 Ridgemont Dr is a home located in Dallas County with nearby schools including Dan D Rogers Elementary School, Benjamin Franklin International Exploratory Academy, and Hillcrest High School.
Ownership History
Date
Name
Owned For
Owner Type
Purchase Details
Closed on
Aug 20, 2021
Sold by
Snyder William Bradford
Bought by
Snyder William Bradford and William Bradford Snyder Jr Living Trust
Current Estimated Value
Purchase Details
Closed on
Apr 13, 2016
Sold by
Switalski Boguslaw and Switalski Delilah Michelle
Bought by
Snyder William Bradford and Snyder Kathy Anders
Purchase Details
Closed on
Sep 27, 2012
Sold by
Baker Jacquelyn and The Judith Dean Houghton Livin
Bought by
Switalski Boguslaw
Home Financials for this Owner
Home Financials are based on the most recent Mortgage that was taken out on this home.
Original Mortgage
$181,115
Interest Rate
3.75%
Mortgage Type
FHA
Purchase Details
Closed on
Sep 2, 2008
Sold by
Houghton Judith Dean
Bought by
Houghton Judith Dean and The Judith Dean Houghton Living Trust
Create a Home Valuation Report for This Property
The Home Valuation Report is an in-depth analysis detailing your home's value as well as a comparison with similar homes in the area
Home Values in the Area
Average Home Value in this Area
Purchase History
| Date | Buyer | Sale Price | Title Company |
|---|---|---|---|
| Snyder William Bradford | -- | None Available | |
| Snyder William Bradford | -- | None Available | |
| Switalski Boguslaw | -- | None Available | |
| Houghton Judith Dean | -- | None Available |
Source: Public Records
Mortgage History
| Date | Status | Borrower | Loan Amount |
|---|---|---|---|
| Previous Owner | Switalski Boguslaw | $181,115 |
Source: Public Records
Tax History Compared to Growth
Tax History
| Year | Tax Paid | Tax Assessment Tax Assessment Total Assessment is a certain percentage of the fair market value that is determined by local assessors to be the total taxable value of land and additions on the property. | Land | Improvement |
|---|---|---|---|---|
| 2025 | $5,166 | $552,310 | $381,850 | $170,460 |
| 2024 | $5,166 | $654,730 | $290,000 | $364,730 |
| 2023 | $5,166 | $499,950 | $260,000 | $239,950 |
| 2022 | $12,132 | $485,220 | $260,000 | $225,220 |
| 2021 | $11,980 | $454,120 | $240,000 | $214,120 |
| 2020 | $12,320 | $454,120 | $240,000 | $214,120 |
| 2019 | $12,921 | $454,120 | $240,000 | $214,120 |
| 2018 | $10,224 | $375,990 | $180,000 | $195,990 |
| 2017 | $10,481 | $385,430 | $180,000 | $205,430 |
| 2016 | $10,481 | $385,430 | $180,000 | $205,430 |
| 2015 | $5,302 | $279,490 | $135,000 | $144,490 |
| 2014 | $5,302 | $193,310 | $100,000 | $93,310 |
Source: Public Records
Map
Nearby Homes
- 6546 E Lovers Ln
- 6646 E Lovers Ln Unit 602
- 6646 E Lovers Ln Unit 808
- 6646 E Lovers Ln Unit 501
- 6646 E Lovers Ln Unit 702
- 6646 E Lovers Ln Unit 301
- 6646 E Lovers Ln Unit 1308
- 6646 E Lovers Ln Unit 1201
- 6611 Highgate Ln
- 6717 Pimlico Dr
- 6517 Highgate Ln
- 6742 E Northwest Hwy
- 6754 E Northwest Hwy
- 6772 E Northwest Hwy
- 6665 Santa Anita Dr
- 6660 Santa Anita Dr
- 6431 Dunstan Ln
- 6644 Santa Anita Dr
- 6333 Town Hill Ln
- 6350 Glennox Ln
- 6475 Ridgemont Dr
- 6465 Ridgemont Dr
- 6556 Chicory Ct
- 6560 Chicory Ct
- 6564 Chicory Ct
- 6552 Chicory Ct
- 6548 Chicory Ct
- 6459 Ridgemont Dr
- 6477 Ridgemont Dr
- 6568 Chicory Ct
- 6544 Chicory Ct
- 6572 Chicory Ct
- 6605 Aintree Cir
- 6540 Chicory Ct
- 6536 Chicory Ct
- 6514 Arborist Ln
- 6532 Chicory Ct
- 6604 Aintree Cir
- 6528 Chicory Ct
- 6580 Chicory Ct