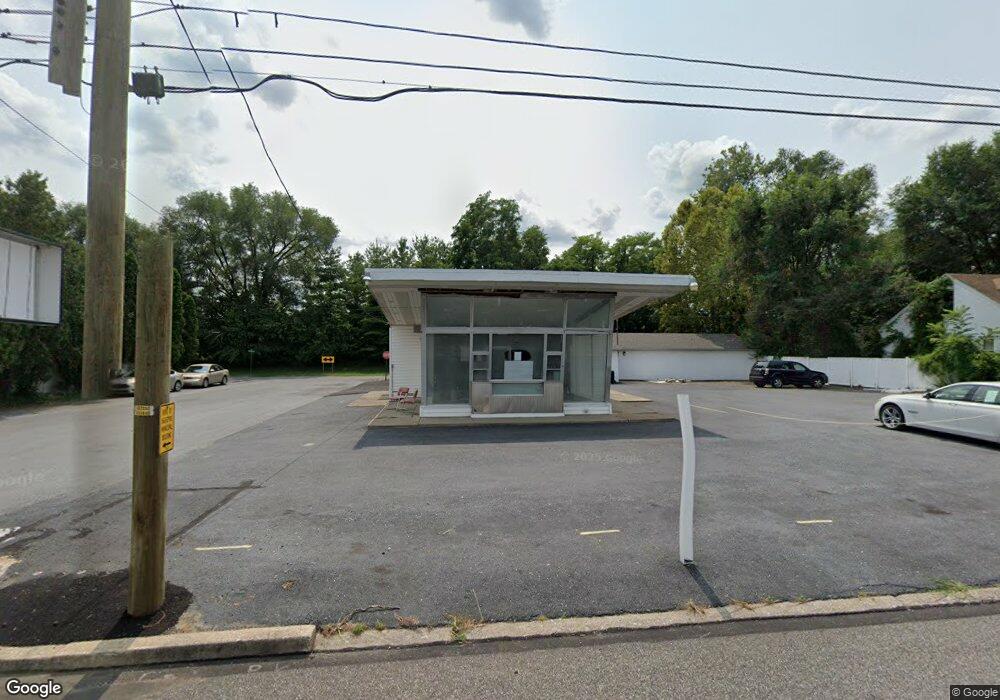
647 2nd St Highspire, PA 17034
Estimated Value: $191,265
--
Bed
--
Bath
2,460
Sq Ft
$78/Sq Ft
Est. Value
About This Home
This home is located at 647 2nd St, Highspire, PA 17034 and is currently estimated at $191,265, approximately $77 per square foot. 647 2nd St is a home located in Dauphin County with nearby schools including Steelton-Highspire El School, Steelton-Highspire High School, and Seven Sorrows of BVM School.
Ownership History
Date
Name
Owned For
Owner Type
Purchase Details
Closed on
Jun 2, 2022
Sold by
Klingler Ronald L
Bought by
Lakeside Auto Sale & Service Llc
Current Estimated Value
Purchase Details
Closed on
May 12, 2008
Sold by
Dintiman Delilah R
Bought by
Klingler Ronald L
Home Financials for this Owner
Home Financials are based on the most recent Mortgage that was taken out on this home.
Original Mortgage
$128,000
Interest Rate
5.94%
Mortgage Type
Commercial
Create a Home Valuation Report for This Property
The Home Valuation Report is an in-depth analysis detailing your home's value as well as a comparison with similar homes in the area
Home Values in the Area
Average Home Value in this Area
Purchase History
| Date | Buyer | Sale Price | Title Company |
|---|---|---|---|
| Lakeside Auto Sale & Service Llc | $160,000 | Cherewka Law Pc | |
| Klingler Ronald L | $160,000 | -- |
Source: Public Records
Mortgage History
| Date | Status | Borrower | Loan Amount |
|---|---|---|---|
| Previous Owner | Klingler Ronald L | $128,000 |
Source: Public Records
Tax History Compared to Growth
Tax History
| Year | Tax Paid | Tax Assessment Tax Assessment Total Assessment is a certain percentage of the fair market value that is determined by local assessors to be the total taxable value of land and additions on the property. | Land | Improvement |
|---|---|---|---|---|
| 2025 | $6,084 | $107,300 | $43,300 | $64,000 |
| 2024 | $5,762 | $107,300 | $43,300 | $64,000 |
| 2023 | $5,762 | $107,300 | $43,300 | $64,000 |
| 2022 | $5,762 | $107,300 | $43,300 | $64,000 |
| 2021 | $5,762 | $107,300 | $43,300 | $64,000 |
| 2020 | $5,762 | $107,300 | $43,300 | $64,000 |
| 2019 | $3,102 | $107,300 | $43,300 | $64,000 |
| 2018 | $5,575 | $107,300 | $43,300 | $64,000 |
| 2017 | $5,575 | $107,300 | $43,300 | $64,000 |
| 2016 | $0 | $107,300 | $43,300 | $64,000 |
| 2015 | -- | $107,300 | $43,300 | $64,000 |
| 2014 | -- | $107,300 | $43,300 | $64,000 |
Source: Public Records
Map
Nearby Homes