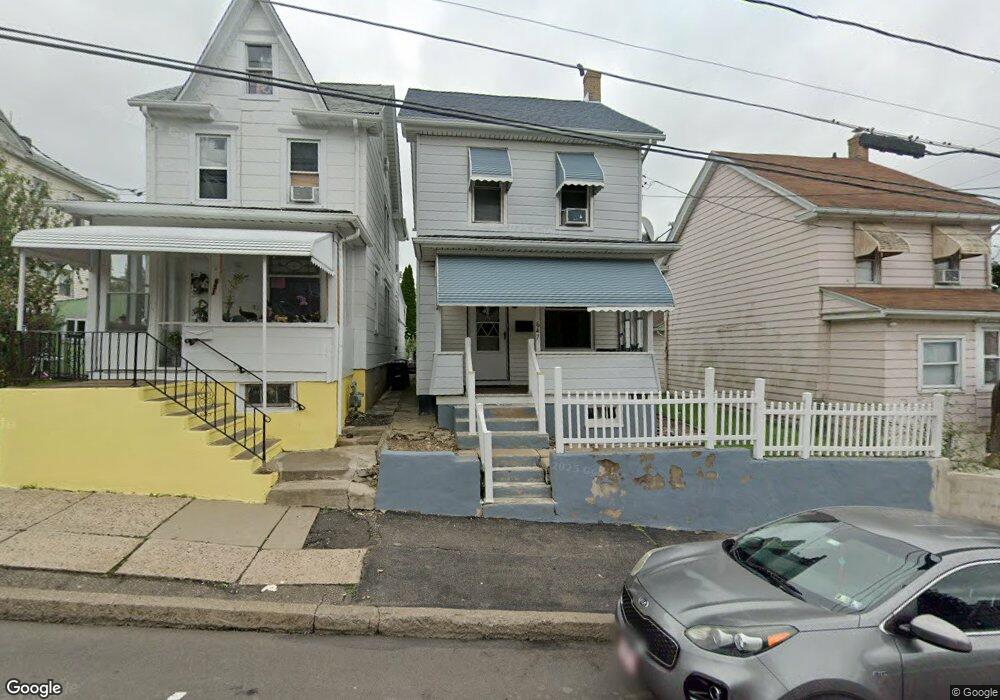
647 Carson St Hazleton, PA 18201
Estimated Value: $158,000 - $203,000
3
Beds
1
Bath
1,024
Sq Ft
$174/Sq Ft
Est. Value
About This Home
This home is located at 647 Carson St, Hazleton, PA 18201 and is currently estimated at $177,755, approximately $173 per square foot. 647 Carson St is a home located in Luzerne County with nearby schools including Hazleton Area High School, Holy Family Academy, and Immanuel Christian School.
Ownership History
Date
Name
Owned For
Owner Type
Purchase Details
Closed on
Jul 6, 2018
Sold by
Shema David
Bought by
Medina Yerlys
Current Estimated Value
Home Financials for this Owner
Home Financials are based on the most recent Mortgage that was taken out on this home.
Original Mortgage
$79,540
Outstanding Balance
$68,366
Interest Rate
4.6%
Mortgage Type
New Conventional
Estimated Equity
$109,389
Purchase Details
Closed on
May 12, 2009
Sold by
Shema David and Michelli Amy T
Bought by
Shema David
Home Financials for this Owner
Home Financials are based on the most recent Mortgage that was taken out on this home.
Original Mortgage
$68,000
Interest Rate
4.71%
Mortgage Type
New Conventional
Purchase Details
Closed on
Nov 6, 2007
Sold by
Brugger Michael N and Brugger Joan A
Bought by
Shema David and Michelli Amy T
Home Financials for this Owner
Home Financials are based on the most recent Mortgage that was taken out on this home.
Original Mortgage
$64,800
Interest Rate
6.47%
Mortgage Type
Purchase Money Mortgage
Create a Home Valuation Report for This Property
The Home Valuation Report is an in-depth analysis detailing your home's value as well as a comparison with similar homes in the area
Home Values in the Area
Average Home Value in this Area
Purchase History
| Date | Buyer | Sale Price | Title Company |
|---|---|---|---|
| Medina Yerlys | $82,000 | Northeast Settlement Company | |
| Shema David | -- | Huntington Title & Escrow Ll | |
| Shema David | $81,000 | None Available |
Source: Public Records
Mortgage History
| Date | Status | Borrower | Loan Amount |
|---|---|---|---|
| Open | Medina Yerlys | $79,540 | |
| Previous Owner | Shema David | $68,000 | |
| Previous Owner | Shema David | $64,800 |
Source: Public Records
Tax History
| Year | Tax Paid | Tax Assessment Tax Assessment Total Assessment is a certain percentage of the fair market value that is determined by local assessors to be the total taxable value of land and additions on the property. | Land | Improvement |
|---|---|---|---|---|
| 2026 | $1,565 | $76,200 | $28,300 | $47,900 |
| 2025 | $2,189 | $76,200 | $28,300 | $47,900 |
| 2024 | $2,051 | $76,200 | $28,300 | $47,900 |
| 2023 | $1,917 | $76,200 | $28,300 | $47,900 |
| 2022 | $1,903 | $76,200 | $28,300 | $47,900 |
| 2021 | $1,859 | $76,200 | $28,300 | $47,900 |
| 2020 | $1,661 | $76,200 | $28,300 | $47,900 |
| 2019 | $1,714 | $76,200 | $28,300 | $47,900 |
| 2018 | $1,656 | $76,200 | $28,300 | $47,900 |
| 2017 | $1,526 | $76,200 | $28,300 | $47,900 |
| 2016 | $700 | $76,200 | $28,300 | $47,900 |
| 2015 | $667 | $76,200 | $28,300 | $47,900 |
| 2014 | $667 | $76,200 | $28,300 | $47,900 |
Source: Public Records
Map
Nearby Homes
- 14 W 4th St
- 756 Seybert St
- ER.126 W Aspen St
- 127 W Diamond Ave
- 403 W 7th St
- 187 N Church St
- 911 Seybert St
- 714 Alter St
- 116 N Laurel St
- 616 Monges St
- 897 N Vine St
- 90 N Cedar St
- 991 Seybert St
- 0 Church Unit PALU2002778
- 52 N Laurel St
- 360 W Spruce St
- 239 E 23rd St
- 418 E Mine St
- 101 S Wyoming St
- 1087 Lafayette Ct
Your Personal Tour Guide
Ask me questions while you tour the home.