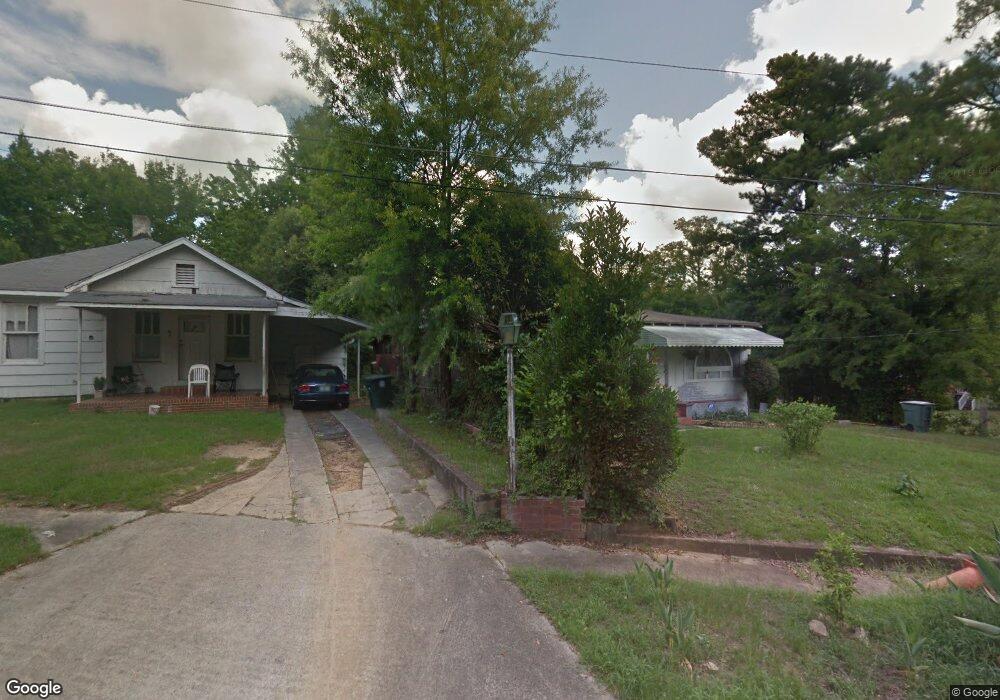
647 Cliffview Dr Macon, GA 31206
Estimated Value: $27,997 - $53,000
2
Beds
1
Bath
1,448
Sq Ft
$26/Sq Ft
Est. Value
About This Home
This home is located at 647 Cliffview Dr, Macon, GA 31206 and is currently estimated at $36,999, approximately $25 per square foot. 647 Cliffview Dr is a home located in Bibb County with nearby schools including Ingram-Pye Elementary School, Southwest High School, and Cirrus Charter Academy.
Ownership History
Date
Name
Owned For
Owner Type
Purchase Details
Closed on
Jul 7, 2025
Sold by
William Friedmann Roth Ira and Provident Trust Group Llc
Bought by
Berrios Johnny R
Current Estimated Value
Purchase Details
Closed on
Mar 5, 2019
Sold by
Wilmington Savings Fund Society
Bought by
Provident Trust Group Llc and William Friedmann Roth Ira
Purchase Details
Closed on
Feb 1, 2017
Sold by
Sg Capital Partners Llc
Bought by
The Dexter Group Trust and Wilmington Savings Fund Society Fsb
Purchase Details
Closed on
Dec 8, 2015
Sold by
Harbour Portfolio Vi Lp
Bought by
Sg Capital Partners Llc
Purchase Details
Closed on
Aug 6, 2013
Sold by
Harbour Portfolio Vi Lp
Bought by
State Bank And Trust Company
Purchase Details
Closed on
Dec 28, 2010
Sold by
Netnet Llc
Bought by
Harbour Portfolio Vi Lp
Purchase Details
Closed on
Jan 29, 2009
Sold by
Green Tree Servicing Llc
Bought by
Netnet Llc
Purchase Details
Closed on
Aug 5, 2008
Sold by
Williams Margie A
Bought by
Greentree Servicing Llc
Create a Home Valuation Report for This Property
The Home Valuation Report is an in-depth analysis detailing your home's value as well as a comparison with similar homes in the area
Home Values in the Area
Average Home Value in this Area
Purchase History
| Date | Buyer | Sale Price | Title Company |
|---|---|---|---|
| Berrios Johnny R | $27,900 | None Listed On Document | |
| Provident Trust Group Llc | $14,600 | None Available | |
| The Dexter Group Trust | $14,874 | None Available | |
| Sg Capital Partners Llc | $16,103 | -- | |
| State Bank And Trust Company | $10,000 | -- | |
| Harbour Portfolio Vi Lp | $10,500 | -- | |
| Harbour Portfolio Vi Lp | $10,465 | None Available | |
| Netnet Llc | $43,000 | None Available | |
| Greentree Servicing Llc | $44,100 | -- | |
| Green Tree Servicing Llc | $44,095 | None Available |
Source: Public Records
Tax History Compared to Growth
Tax History
| Year | Tax Paid | Tax Assessment Tax Assessment Total Assessment is a certain percentage of the fair market value that is determined by local assessors to be the total taxable value of land and additions on the property. | Land | Improvement |
|---|---|---|---|---|
| 2025 | $524 | $21,315 | $2,760 | $18,555 |
| 2024 | $541 | $21,315 | $2,760 | $18,555 |
| 2023 | $458 | $18,042 | $1,840 | $16,202 |
| 2022 | $484 | $13,981 | $2,334 | $11,647 |
| 2021 | $368 | $9,678 | $1,125 | $8,553 |
| 2020 | $227 | $9,678 | $1,125 | $8,553 |
| 2019 | $341 | $8,704 | $1,058 | $7,646 |
| 2018 | $702 | $8,704 | $1,058 | $7,646 |
| 2017 | $326 | $8,704 | $1,058 | $7,646 |
| 2016 | $301 | $8,705 | $1,058 | $7,646 |
| 2015 | $493 | $10,070 | $1,058 | $9,012 |
| 2014 | $567 | $10,070 | $1,058 | $9,012 |
Source: Public Records
Map
Nearby Homes
- 725 Saint James Ave
- 622 Cleveland St
- 780 Ponce de Leon Ave
- 587 Robert Henry St
- 561 Rutherford Ave
- 823 Ponce de Leon Ave
- 837 Lackey Dr
- 538 Cleveland St
- 648 Hightower Rd
- 534 Robert Henry St
- 534 Hanson St
- 2758 Houston Ave
- 554 Nelson St
- 3402 Antioch Rd
- 730 Newberg Ave
- 797 Newberg Ave
- 532 Nelson St
- 3141 Edlay Place
- 678 Dixie Ave
- 0 Cliffview Dr Unit 7528128
- 655 Cliffview Dr
- 663 Cliffview Dr
- 629 Cliffview Dr
- 644 Rutherford Ave
- 640 Cliffview Dr
- 3020 Houston Ave
- 607 Cliffview Dr
- 605 Cliffview Dr
- 638 Rutherford Ave
- 523 Franklin St S
- 3045 Houston Ave
- 3061 Houston Ave
- 606 Rutherford Ave
- 614 Rutherford Ave
- 3033 Houston Ave
- 604 Cliffview Dr
- 675 Franklin St S
- 669 Rutherford Ave
- 657 Rutherford Ave