647 Golf Ln Unit 959 Lake Barrington, IL 60010
Lake Barrington Shores NeighborhoodEstimated Value: $314,000 - $419,000
2
Beds
2
Baths
1,550
Sq Ft
$232/Sq Ft
Est. Value
About This Home
This home is located at 647 Golf Ln Unit 959, Lake Barrington, IL 60010 and is currently estimated at $359,436, approximately $231 per square foot. 647 Golf Ln Unit 959 is a home located in Lake County with nearby schools including North Barrington Elementary School, Barrington Mdle School- Prairie Cmps, and Barrington High School.
Ownership History
Date
Name
Owned For
Owner Type
Purchase Details
Closed on
Sep 28, 2016
Sold by
Koruna Paula and Koruna Nancy Josephine
Bought by
Smith Mark W and Renskers Kim M
Current Estimated Value
Home Financials for this Owner
Home Financials are based on the most recent Mortgage that was taken out on this home.
Original Mortgage
$136,000
Outstanding Balance
$110,021
Interest Rate
3.75%
Mortgage Type
New Conventional
Estimated Equity
$249,415
Purchase Details
Closed on
May 14, 2001
Sold by
Krambaer Kitty A
Bought by
Koruna Paul and Koruna Nancy Josephine
Purchase Details
Closed on
Jul 8, 1996
Sold by
Patrick Michael S and Patrick Jacqueline L
Bought by
Krambaer Kitty A
Purchase Details
Closed on
May 18, 1994
Sold by
Nbd Bank
Bought by
Patrick Michael S and Patrick Jacqueline L
Home Financials for this Owner
Home Financials are based on the most recent Mortgage that was taken out on this home.
Original Mortgage
$134,400
Interest Rate
5.9%
Create a Home Valuation Report for This Property
The Home Valuation Report is an in-depth analysis detailing your home's value as well as a comparison with similar homes in the area
Home Values in the Area
Average Home Value in this Area
Purchase History
| Date | Buyer | Sale Price | Title Company |
|---|---|---|---|
| Smith Mark W | $170,000 | Premier Title | |
| Koruna Paul | $202,500 | -- | |
| Krambaer Kitty A | -- | -- | |
| Patrick Michael S | $168,000 | -- |
Source: Public Records
Mortgage History
| Date | Status | Borrower | Loan Amount |
|---|---|---|---|
| Open | Smith Mark W | $136,000 | |
| Previous Owner | Patrick Michael S | $134,400 |
Source: Public Records
Tax History Compared to Growth
Tax History
| Year | Tax Paid | Tax Assessment Tax Assessment Total Assessment is a certain percentage of the fair market value that is determined by local assessors to be the total taxable value of land and additions on the property. | Land | Improvement |
|---|---|---|---|---|
| 2024 | $4,852 | $92,502 | $7,767 | $84,735 |
| 2023 | $4,963 | $81,731 | $7,362 | $74,369 |
| 2022 | $4,963 | $78,363 | $8,329 | $70,034 |
| 2021 | $4,888 | $77,030 | $8,187 | $68,843 |
| 2020 | $4,774 | $76,792 | $8,162 | $68,630 |
| 2019 | $4,580 | $74,766 | $7,947 | $66,819 |
| 2018 | $4,375 | $63,300 | $8,420 | $54,880 |
| 2017 | $4,328 | $62,029 | $8,251 | $53,778 |
| 2016 | $4,236 | $59,689 | $7,940 | $51,749 |
| 2015 | $4,055 | $55,983 | $7,447 | $48,536 |
| 2014 | $3,759 | $49,583 | $8,394 | $41,189 |
| 2012 | $3,816 | $50,435 | $8,538 | $41,897 |
Source: Public Records
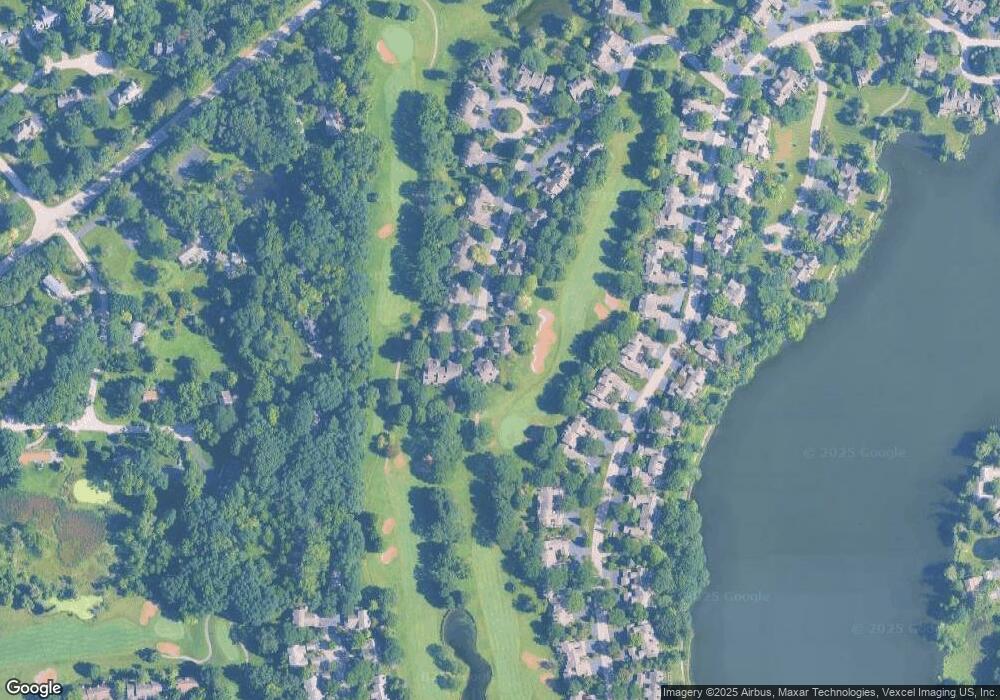
Map
Nearby Homes
- 728 Golf Ln Unit 979
- 12 Chippewa Ct
- 429 Valley View Rd
- 830 Oak Hill Rd
- 660 Old Barn Rd Unit F-24
- 294 Mallard Point Unit A
- 716 Old Barn Rd Unit B
- 535 Woodview Rd
- 315 Bluff Ct Unit C
- 209 Shoreline Rd Unit B
- 729 Old Barn Rd Unit C
- 25146 N West Tower Dr
- 24400 N Kelsey Rd
- 220 Thornhill Ct Unit D
- 928 Longmeadow Ct Unit 1016
- 25 Shoreline Rd Unit B
- 68 Thornhill Ln
- 970 Longmeadow Ct
- 59 Thornhill Ln Unit K176
- 24334 N Grandview Dr
- 647 Golf Ln Unit 647
- 649 Golf Ln Unit 958
- 651 Golf Ln Unit 57
- 653 Golf Ln Unit 653
- 653 Golf Ln
- 639 Golf Ln Unit 960
- 639 Golf Ln Unit 961
- 637 Golf Ln Unit 960
- 637 Golf Ln
- 669 Golf Ln Unit 955
- 669 Golf Ln Unit 669
- 671 Golf Ln
- 671 Golf Ln Unit 954
- 673 Golf Ln Unit 953
- 634 Golf Ln Unit 962
- 675 Golf Ln Unit 952
- 675 Golf Ln Unit 675
- 636 Golf Ln Unit 963
- 656 Golf Ln
- 656 Golf Ln Unit 968