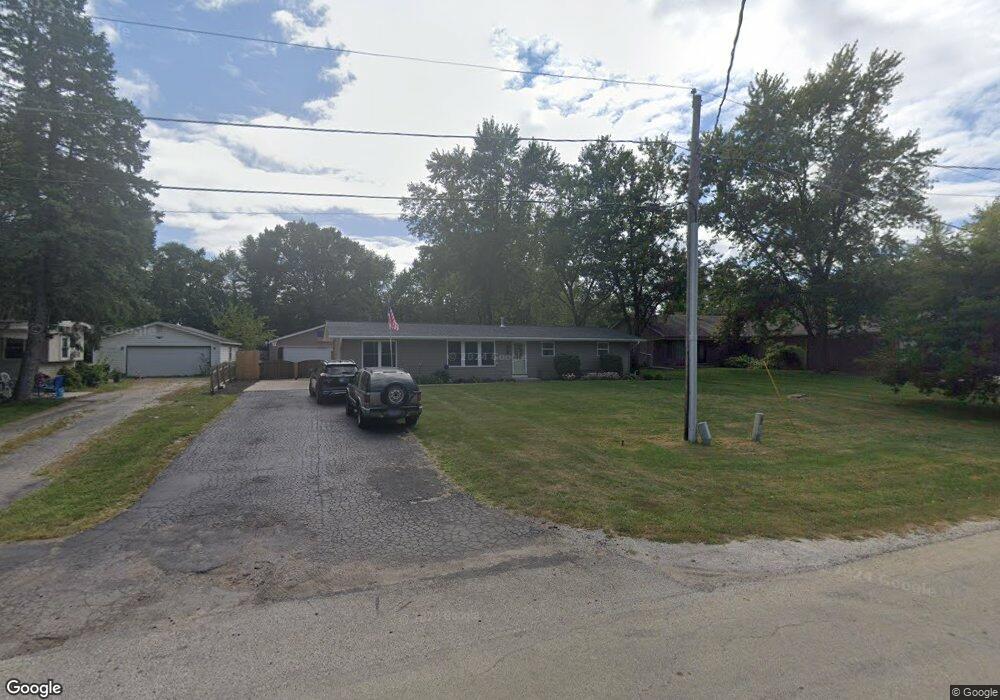
647 W 3rd St Braidwood, IL 60408
Estimated Value: $208,949 - $283,000
3
Beds
--
Bath
--
Sq Ft
25,265
Sq Ft
About This Home
This home is located at 647 W 3rd St, Braidwood, IL 60408 and is currently estimated at $242,737. 647 W 3rd St is a home located in Will County with nearby schools including Reed-Custer Intermediate School, Reed-Custer Middle School, and Reed-Custer High School.
Ownership History
Date
Name
Owned For
Owner Type
Purchase Details
Closed on
Aug 3, 2021
Sold by
Brown Ronald and Estate Of Ronald Brown
Bought by
Brown Matthew S
Current Estimated Value
Home Financials for this Owner
Home Financials are based on the most recent Mortgage that was taken out on this home.
Original Mortgage
$100,000
Outstanding Balance
$90,656
Interest Rate
2.7%
Mortgage Type
New Conventional
Estimated Equity
$152,081
Purchase Details
Closed on
Jun 13, 2005
Sold by
Pacholski Kevin M and Pacholski Michele L
Bought by
Brown Ronald
Purchase Details
Closed on
Mar 15, 1996
Sold by
Richey Randall L and Richey Janice K
Bought by
Pacholski Kevin M and Pacholski Michele L
Home Financials for this Owner
Home Financials are based on the most recent Mortgage that was taken out on this home.
Original Mortgage
$107,100
Interest Rate
7.06%
Mortgage Type
VA
Create a Home Valuation Report for This Property
The Home Valuation Report is an in-depth analysis detailing your home's value as well as a comparison with similar homes in the area
Home Values in the Area
Average Home Value in this Area
Purchase History
| Date | Buyer | Sale Price | Title Company |
|---|---|---|---|
| Brown Matthew S | $160,000 | Fidelity National Title | |
| Brown Ronald | $165,000 | Stewart Title Company | |
| Pacholski Kevin M | $105,000 | -- |
Source: Public Records
Mortgage History
| Date | Status | Borrower | Loan Amount |
|---|---|---|---|
| Open | Brown Matthew S | $100,000 | |
| Previous Owner | Pacholski Kevin M | $107,100 |
Source: Public Records
Tax History
| Year | Tax Paid | Tax Assessment Tax Assessment Total Assessment is a certain percentage of the fair market value that is determined by local assessors to be the total taxable value of land and additions on the property. | Land | Improvement |
|---|---|---|---|---|
| 2024 | $4,704 | $78,372 | $11,155 | $67,217 |
| 2023 | $4,704 | $70,194 | $9,991 | $60,203 |
| 2022 | $3,632 | $63,697 | $9,066 | $54,631 |
| 2021 | $2,608 | $60,797 | $8,653 | $52,144 |
| 2020 | $2,615 | $57,600 | $8,198 | $49,402 |
| 2019 | $2,625 | $54,391 | $7,741 | $46,650 |
| 2018 | $2,647 | $52,049 | $7,408 | $44,641 |
| 2017 | $2,654 | $51,029 | $7,263 | $43,766 |
| 2016 | $2,681 | $49,351 | $7,024 | $42,327 |
| 2015 | $2,660 | $48,077 | $6,843 | $41,234 |
| 2014 | $2,660 | $48,077 | $6,843 | $41,234 |
| 2013 | $2,660 | $51,420 | $7,319 | $44,101 |
Source: Public Records
Map
Nearby Homes
- 430 N Division St
- 484 W 3rd St
- 495 N Division St
- 0000 N Division St
- 386 W 3rd St
- 179 N Maple St
- 903-905 N English St
- 495 W 6th St
- 470 N School St
- 459 N School St
- 599 N School St
- 443 W Main St
- 1034 Madison Ave
- 1018 Madison Ave
- 837 Blackhawk Dr
- 104 S English St
- 116 S English St
- 364 W Anndon St
- 886 Western Ave
- 1055 W Main St
Your Personal Tour Guide
Ask me questions while you tour the home.