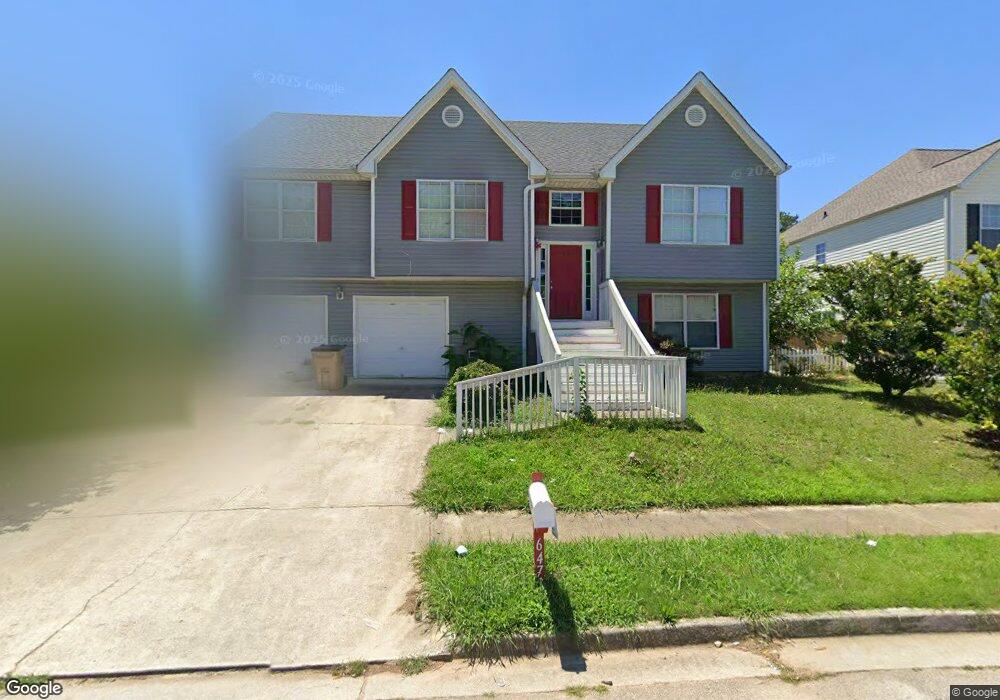
6473 E Meyer Dr Morrow, GA 30260
Estimated Value: $250,000 - $308,000
4
Beds
3
Baths
1,937
Sq Ft
$143/Sq Ft
Est. Value
About This Home
This home is located at 6473 E Meyer Dr, Morrow, GA 30260 and is currently estimated at $276,451, approximately $142 per square foot. 6473 E Meyer Dr is a home located in Clayton County with nearby schools including William M. Mcgarrah Elementary School, Rex Mill Middle School, and Mount Zion High School.
Ownership History
Date
Name
Owned For
Owner Type
Purchase Details
Closed on
Sep 9, 2021
Sold by
P4 Sfr Property Owner 1 Llc
Bought by
Progress Residential Borrower 5 Llc
Current Estimated Value
Purchase Details
Closed on
May 4, 2020
Sold by
Freo Progress Llc
Bought by
P4 Sfr Property Owner 1 Llc
Purchase Details
Closed on
Feb 3, 2020
Sold by
Tran Yen
Bought by
Freo Progress Llc
Purchase Details
Closed on
Sep 23, 2009
Sold by
Tran Yen
Bought by
Tran Yen and Nguyen Troung
Purchase Details
Closed on
Jan 6, 2009
Sold by
Eschman Wayne
Bought by
Fremont Trust 2005-D
Create a Home Valuation Report for This Property
The Home Valuation Report is an in-depth analysis detailing your home's value as well as a comparison with similar homes in the area
Home Values in the Area
Average Home Value in this Area
Purchase History
| Date | Buyer | Sale Price | Title Company |
|---|---|---|---|
| Progress Residential Borrower 5 Llc | -- | -- | |
| P4 Sfr Property Owner 1 Llc | -- | -- | |
| Freo Progress Llc | $163,000 | -- | |
| Tran Yen | -- | -- | |
| Tran Yen | $50,000 | -- | |
| Fremont Trust 2005-D | $73,600 | -- |
Source: Public Records
Property History
| Date | Event | Price | List to Sale | Price per Sq Ft |
|---|---|---|---|---|
| 02/13/2026 02/13/26 | Off Market | $2,480 | -- | -- |
| 02/07/2026 02/07/26 | Price Changed | $2,480 | +0.2% | $1 / Sq Ft |
| 02/05/2026 02/05/26 | Price Changed | $2,475 | -2.9% | $1 / Sq Ft |
| 01/31/2026 01/31/26 | Price Changed | $2,550 | +2.0% | $1 / Sq Ft |
| 01/29/2026 01/29/26 | Price Changed | $2,500 | 0.0% | $1 / Sq Ft |
| 01/29/2026 01/29/26 | For Rent | $2,500 | +1.0% | -- |
| 06/01/2025 06/01/25 | Off Market | $2,475 | -- | -- |
| 05/22/2025 05/22/25 | Price Changed | $2,475 | +0.2% | $1 / Sq Ft |
| 05/20/2025 05/20/25 | Price Changed | $2,470 | -1.0% | $1 / Sq Ft |
| 05/19/2025 05/19/25 | Price Changed | $2,495 | -0.2% | $1 / Sq Ft |
| 05/16/2025 05/16/25 | Price Changed | $2,500 | -0.2% | $1 / Sq Ft |
| 05/15/2025 05/15/25 | Price Changed | $2,505 | -0.2% | $1 / Sq Ft |
| 05/15/2025 05/15/25 | Price Changed | $2,510 | +0.2% | $1 / Sq Ft |
| 05/12/2025 05/12/25 | Price Changed | $2,505 | -0.2% | $1 / Sq Ft |
| 05/11/2025 05/11/25 | Price Changed | $2,510 | +1.4% | $1 / Sq Ft |
| 05/08/2025 05/08/25 | Price Changed | $2,475 | -0.8% | $1 / Sq Ft |
| 05/07/2025 05/07/25 | Price Changed | $2,495 | -0.2% | $1 / Sq Ft |
| 05/01/2025 05/01/25 | Price Changed | $2,500 | -0.4% | $1 / Sq Ft |
| 04/30/2025 04/30/25 | Price Changed | $2,510 | +0.2% | $1 / Sq Ft |
| 04/29/2025 04/29/25 | Price Changed | $2,505 | +0.2% | $1 / Sq Ft |
| 04/27/2025 04/27/25 | Price Changed | $2,500 | -0.6% | $1 / Sq Ft |
| 04/24/2025 04/24/25 | Price Changed | $2,515 | +2.2% | $1 / Sq Ft |
| 04/23/2025 04/23/25 | Price Changed | $2,460 | -0.2% | $1 / Sq Ft |
| 04/22/2025 04/22/25 | Price Changed | $2,465 | -0.2% | $1 / Sq Ft |
| 04/22/2025 04/22/25 | Price Changed | $2,470 | -1.0% | $1 / Sq Ft |
| 04/20/2025 04/20/25 | Price Changed | $2,495 | -0.4% | $1 / Sq Ft |
| 04/15/2025 04/15/25 | Price Changed | $2,505 | +1.8% | $1 / Sq Ft |
| 04/12/2025 04/12/25 | Price Changed | $2,460 | +2.3% | $1 / Sq Ft |
| 04/11/2025 04/11/25 | Price Changed | $2,405 | +1.9% | $1 / Sq Ft |
| 03/20/2025 03/20/25 | Price Changed | $2,360 | -28.7% | $1 / Sq Ft |
| 03/18/2025 03/18/25 | For Rent | $3,310 | -- | -- |
Tax History
| Year | Tax Paid | Tax Assessment Tax Assessment Total Assessment is a certain percentage of the fair market value that is determined by local assessors to be the total taxable value of land and additions on the property. | Land | Improvement |
|---|---|---|---|---|
| 2025 | $3,906 | $100,997 | $9,090 | $91,907 |
| 2024 | $3,185 | $104,120 | $9,600 | $94,520 |
| 2023 | $2,951 | $80,680 | $9,600 | $71,080 |
| 2022 | $3,008 | $75,680 | $9,600 | $66,080 |
| 2021 | $2,613 | $65,200 | $8,880 | $56,320 |
| 2020 | $2,358 | $58,013 | $9,600 | $48,413 |
| 2019 | $1,688 | $40,634 | $9,600 | $31,034 |
| 2018 | $1,738 | $41,870 | $9,600 | $32,270 |
| 2017 | $1,277 | $30,445 | $9,600 | $20,845 |
| 2016 | $1,286 | $30,662 | $9,600 | $21,062 |
| 2015 | $1,265 | $0 | $0 | $0 |
| 2014 | $1,213 | $29,546 | $9,600 | $19,946 |
Source: Public Records
Map
Nearby Homes
- 6397 E Meyer Dr
- 6380 Mount Zion Blvd
- 2575 Stratford Ln
- 2613 Stratford Ln Unit 3
- 6584 Sleepy Hollow Ln
- 2617 Terrace Pkwy
- 2845 Heritage Ln
- 6486 Aquila Dr
- 2497 Celina Ct
- 2688 Heritage Ln
- 6227 Mount Zion Blvd
- 2681 Heritage Ln
- 2705 Heritage Ln
- 6266 Culver Dr
- 2455 Lake Harbin Rd
- 6485 Bobolink Ct
- 6560 Maddox Rd
- 6389 Warbler Ct
- 6379 Warbler Ct
- 6387 Warbler Ct
- 6467 E Meyer Dr
- 6479 E Meyer Dr
- 6468 E Meyer Dr
- E E Meyer Dr
- 6463 E Meyer Dr
- 6462 E Meyer Dr
- 6486 E Meyer Dr
- 6456 E Meyer Dr
- 6480 E Meyer Dr
- 6457 E Meyer Dr
- 6481 E Meyer Dr
- 6492 E Meyer Dr
- 6450 E Meyer Dr
- 6480 W Meyer Ct
- 6488 W Meyer Ct
- 6451 E Meyer Dr
- 6444 E Meyer Dr
- 6469 Pine Bark Ct
- 6472 W Meyer Ct
- 6445 E Meyer Dr
Your Personal Tour Guide
Ask me questions while you tour the home.