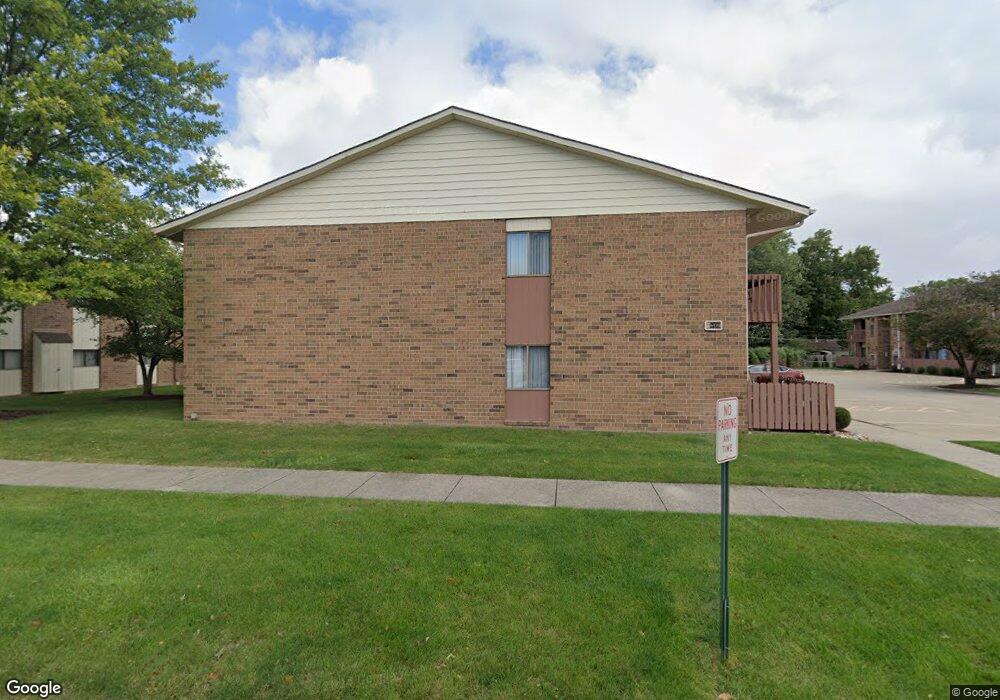
6475 Princeton Ct Parma Heights, OH 44130
Estimated Value: $130,000 - $139,810
2
Beds
2
Baths
1,144
Sq Ft
$118/Sq Ft
Est. Value
About This Home
This home is located at 6475 Princeton Ct, Parma Heights, OH 44130 and is currently estimated at $135,203, approximately $118 per square foot. 6475 Princeton Ct is a home located in Cuyahoga County with nearby schools including Greenbriar Middle School, Pleasant Valley Elementary School, and Valley Forge High School.
Ownership History
Date
Name
Owned For
Owner Type
Purchase Details
Closed on
Sep 25, 2024
Sold by
Stopar Paul E and Stopar Linda S
Bought by
Overstreet Deborah Lynn and Overstreet Donald Madison
Current Estimated Value
Home Financials for this Owner
Home Financials are based on the most recent Mortgage that was taken out on this home.
Original Mortgage
$123,500
Outstanding Balance
$122,236
Interest Rate
6.49%
Mortgage Type
New Conventional
Estimated Equity
$12,967
Purchase Details
Closed on
Aug 29, 2005
Sold by
Tjrs Inc
Bought by
Stopar Paul E and Stopar Linda S
Home Financials for this Owner
Home Financials are based on the most recent Mortgage that was taken out on this home.
Original Mortgage
$68,900
Interest Rate
7%
Mortgage Type
Fannie Mae Freddie Mac
Create a Home Valuation Report for This Property
The Home Valuation Report is an in-depth analysis detailing your home's value as well as a comparison with similar homes in the area
Home Values in the Area
Average Home Value in this Area
Purchase History
| Date | Buyer | Sale Price | Title Company |
|---|---|---|---|
| Overstreet Deborah Lynn | $130,000 | Infinity Title | |
| Stopar Paul E | $88,900 | U S Title Agency |
Source: Public Records
Mortgage History
| Date | Status | Borrower | Loan Amount |
|---|---|---|---|
| Open | Overstreet Deborah Lynn | $123,500 | |
| Previous Owner | Stopar Paul E | $68,900 |
Source: Public Records
Tax History Compared to Growth
Tax History
| Year | Tax Paid | Tax Assessment Tax Assessment Total Assessment is a certain percentage of the fair market value that is determined by local assessors to be the total taxable value of land and additions on the property. | Land | Improvement |
|---|---|---|---|---|
| 2024 | $2,576 | $41,370 | $4,130 | $37,240 |
| 2023 | $2,065 | $28,920 | $2,980 | $25,940 |
| 2022 | $2,053 | $28,910 | $2,975 | $25,935 |
| 2021 | $2,115 | $28,910 | $2,980 | $25,940 |
| 2020 | $1,932 | $23,700 | $2,450 | $21,250 |
| 2019 | $1,879 | $67,700 | $7,000 | $60,700 |
| 2018 | $1,903 | $23,700 | $2,450 | $21,250 |
| 2017 | $1,934 | $22,930 | $2,450 | $20,480 |
| 2016 | $1,920 | $22,930 | $2,450 | $20,480 |
| 2015 | $2,227 | $22,930 | $2,450 | $20,480 |
| 2014 | $2,227 | $26,990 | $2,870 | $24,120 |
Source: Public Records
Map
Nearby Homes
- 6395 Princeton Ct Unit 203H
- 6525 Aylesworth Dr
- 9736 Manorford Dr
- 6400 Stratford Dr
- 9355 Newkirk Dr
- 6418 Newland Rd
- 6359 Olde York Rd Unit 6359
- 10438 N Church Dr
- 9313 Crestwood Dr
- 8963 Lynnhaven Rd
- 6375 Sherborn Rd
- 8767 Lynnhaven Rd
- 6191 Stratford Dr
- 6842 Greenbriar Dr
- 10761 Blossom Ave
- 8314 Oxford Dr
- 8218 Covington Ave
- 6111 Denison Blvd
- 8102 Whitehaven Dr
- 8021 Whitehaven Dr
- 6475 Princeton Ct Unit 204
- 6475 Princeton Ct Unit D203
- 6475 Princeton Ct
- 6475 Princeton Ct Unit D103
- 6475 Princeton Ct
- 6475 Princeton Ct
- 6475 Princeton Ct Unit D-202
- 6495 Princeton Ct Unit C-202
- 6495 Princeton Ct
- 6495 Princeton Ct
- 6495 Princeton Ct
- 6495 Princeton Ct
- 6495 Princeton Ct
- 6495 Princeton Ct Unit 101
- 6495 Princeton Ct Unit C103
- 6495 Princeton Ct Unit 202C
- 6495 Princeton Ct Unit 204C
- 6495 Princeton Ct Unit C-204
- 6495 Princeton Ct Unit C201
- 6495 Princeton Ct Unit C-203