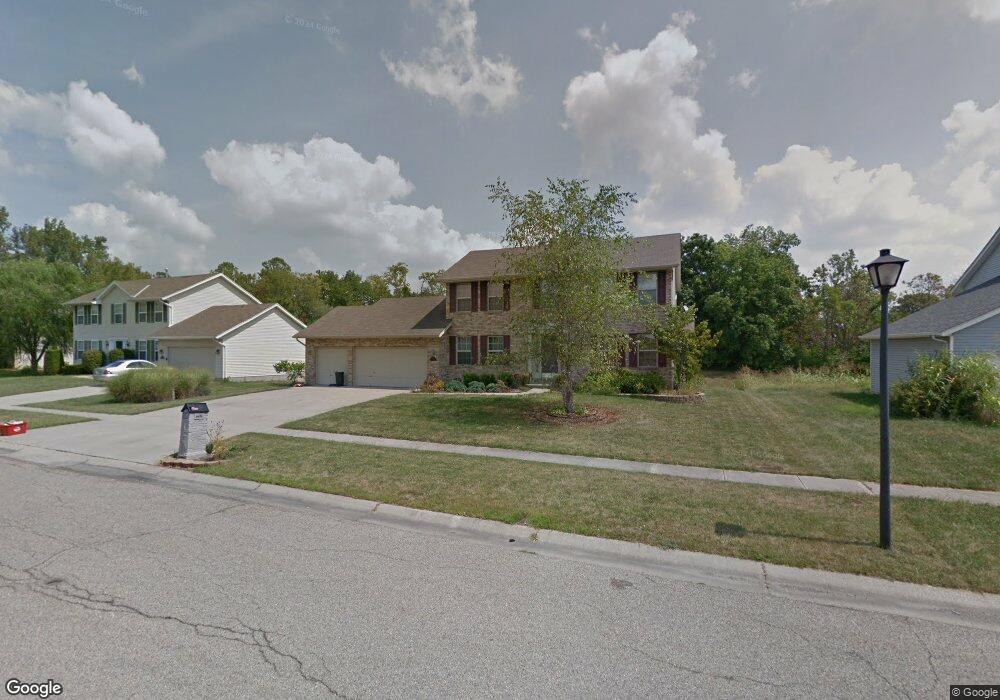
6476 Colonial Orchard Ct Liberty Township, OH 45011
Estimated Value: $404,946 - $419,000
4
Beds
4
Baths
2,047
Sq Ft
$200/Sq Ft
Est. Value
About This Home
This home is located at 6476 Colonial Orchard Ct, Liberty Township, OH 45011 and is currently estimated at $410,237, approximately $200 per square foot. 6476 Colonial Orchard Ct is a home located in Butler County with nearby schools including Heritage Early Childhood School, Cherokee Elementary School, and Lakota Plains Junior School.
Ownership History
Date
Name
Owned For
Owner Type
Purchase Details
Closed on
Mar 10, 2005
Sold by
Cash Donald J and Cash Angela K
Bought by
Gebert Eric and Gebert Kimberly
Current Estimated Value
Home Financials for this Owner
Home Financials are based on the most recent Mortgage that was taken out on this home.
Original Mortgage
$130,000
Outstanding Balance
$66,037
Interest Rate
5.64%
Mortgage Type
Stand Alone First
Estimated Equity
$344,200
Purchase Details
Closed on
Jul 16, 2001
Sold by
J Ii Homes Inc
Bought by
Cash Donald J
Home Financials for this Owner
Home Financials are based on the most recent Mortgage that was taken out on this home.
Original Mortgage
$131,050
Interest Rate
6.99%
Purchase Details
Closed on
Jul 13, 2001
Sold by
Schwarz Joseph W Tr
Bought by
J Ii Homes Inc
Home Financials for this Owner
Home Financials are based on the most recent Mortgage that was taken out on this home.
Original Mortgage
$131,050
Interest Rate
6.99%
Create a Home Valuation Report for This Property
The Home Valuation Report is an in-depth analysis detailing your home's value as well as a comparison with similar homes in the area
Home Values in the Area
Average Home Value in this Area
Purchase History
| Date | Buyer | Sale Price | Title Company |
|---|---|---|---|
| Gebert Eric | $200,000 | First Title Agency Inc | |
| Cash Donald J | $163,829 | -- | |
| J Ii Homes Inc | $29,000 | -- |
Source: Public Records
Mortgage History
| Date | Status | Borrower | Loan Amount |
|---|---|---|---|
| Open | Gebert Eric | $130,000 | |
| Previous Owner | Cash Donald J | $131,050 | |
| Closed | Cash Donald J | $16,383 |
Source: Public Records
Tax History Compared to Growth
Tax History
| Year | Tax Paid | Tax Assessment Tax Assessment Total Assessment is a certain percentage of the fair market value that is determined by local assessors to be the total taxable value of land and additions on the property. | Land | Improvement |
|---|---|---|---|---|
| 2024 | $4,583 | $115,990 | $14,160 | $101,830 |
| 2023 | $4,524 | $117,130 | $14,160 | $102,970 |
| 2022 | $3,860 | $77,370 | $14,160 | $63,210 |
| 2021 | $3,840 | $77,370 | $14,160 | $63,210 |
| 2020 | $3,935 | $77,370 | $14,160 | $63,210 |
| 2019 | $6,620 | $68,720 | $13,360 | $55,360 |
| 2018 | $3,909 | $68,720 | $13,360 | $55,360 |
| 2017 | $3,970 | $68,720 | $13,360 | $55,360 |
| 2016 | $3,536 | $60,860 | $13,360 | $47,500 |
| 2015 | $3,498 | $60,860 | $13,360 | $47,500 |
| 2014 | $3,666 | $60,860 | $13,360 | $47,500 |
| 2013 | $3,666 | $60,750 | $13,360 | $47,390 |
Source: Public Records
Map
Nearby Homes
- 4300 Pheasant Trail Ct
- 1 Princeton Rd
- 4296 Moselle Dr
- 6384 S Snowmass Dr
- 4354 Cody Brook Dr
- 4368 Stone Trace Ln
- 4628 Beech Knoll Ln
- 6406 Whippoorwill Dr
- 6406 Whippoorwill Way
- 4600 Snowbird Dr
- 4377 Stone Creek Dr
- 4077 Bramble Ct
- 6093 Griffin Ct
- 6077 Snow Hill Dr
- 4020 Hickory View Dr
- 4004 Bayberry Dr
- 6731 Forest Hill Ln
- 6875 Crown Pointe Dr
- 4520 Logsdons Meadow Dr
- 4925 Fescue Dr
- 6466 Colonial Orchard Ct
- 6486 Colonial Orchard Ct
- 6456 Colonial Orchard Ct
- 6496 Colonial Orchard Ct
- 6477 Chablis Dr
- 6467 Chablis Dr
- 4320 Pheasant Trail Ct
- 6487 Chablis Dr
- 6457 Chablis Dr
- 6446 Colonial Orchard Ct
- 6497 Chablis Dr
- 6459 Colonial Orchard Ct
- 6499 Colonial Orchard Ct
- 4310 Pheasant Trail Ct
- 6447 Chablis Dr
- 6516 Colonial Orchard Ct
- 6507 Chablis Dr
- 6439 Colonial Orchard Ct
- 6509 Colonial Orchard Ct
- 6436 Colonial Orchard Ct