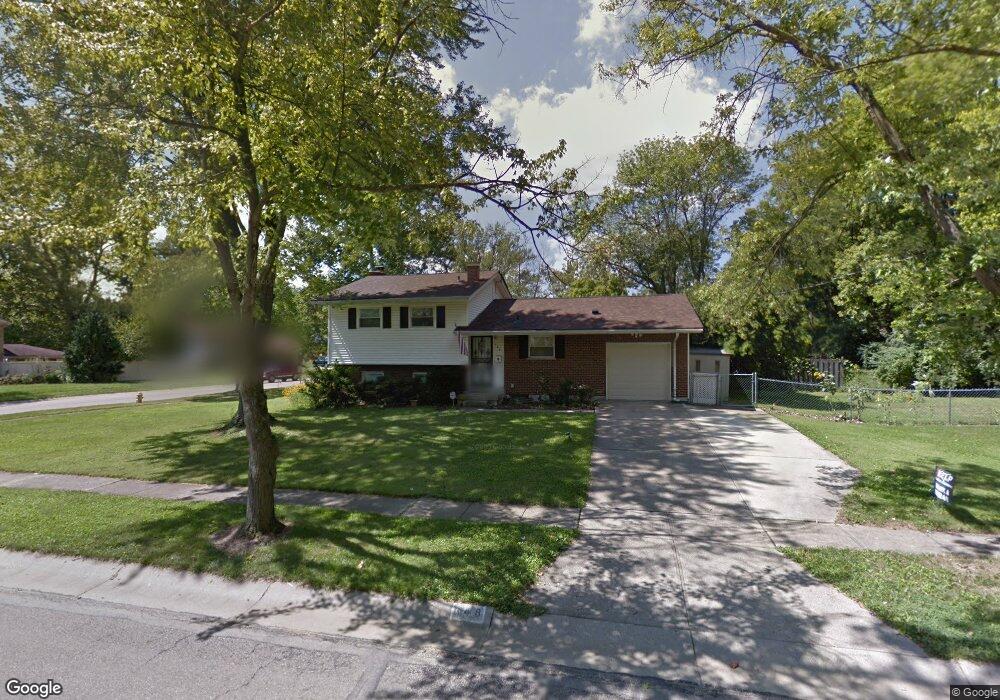
648 Cascade Rd Cincinnati, OH 45240
Estimated Value: $220,811 - $254,000
3
Beds
2
Baths
1,579
Sq Ft
$150/Sq Ft
Est. Value
About This Home
This home is located at 648 Cascade Rd, Cincinnati, OH 45240 and is currently estimated at $236,203, approximately $149 per square foot. 648 Cascade Rd is a home located in Hamilton County with nearby schools including Calvary Academy- The and St Gabriel Consolidated School.
Ownership History
Date
Name
Owned For
Owner Type
Purchase Details
Closed on
May 9, 2007
Sold by
Johnson Joan B
Bought by
Fruth Joseph and Fruth Maria Luz
Current Estimated Value
Home Financials for this Owner
Home Financials are based on the most recent Mortgage that was taken out on this home.
Original Mortgage
$122,477
Outstanding Balance
$73,192
Interest Rate
6.21%
Mortgage Type
VA
Estimated Equity
$163,011
Purchase Details
Closed on
Aug 27, 2001
Sold by
Millet Anthony X
Bought by
Johnson Joan B
Home Financials for this Owner
Home Financials are based on the most recent Mortgage that was taken out on this home.
Original Mortgage
$78,500
Interest Rate
7.03%
Mortgage Type
Unknown
Purchase Details
Closed on
Jan 28, 1998
Sold by
Doherty Adedayo O
Bought by
Millet Anthony K
Home Financials for this Owner
Home Financials are based on the most recent Mortgage that was taken out on this home.
Original Mortgage
$63,100
Interest Rate
7.08%
Create a Home Valuation Report for This Property
The Home Valuation Report is an in-depth analysis detailing your home's value as well as a comparison with similar homes in the area
Home Values in the Area
Average Home Value in this Area
Purchase History
| Date | Buyer | Sale Price | Title Company |
|---|---|---|---|
| Fruth Joseph | $119,900 | Ltoc | |
| Johnson Joan B | $12,700 | -- | |
| Millet Anthony K | $78,900 | -- |
Source: Public Records
Mortgage History
| Date | Status | Borrower | Loan Amount |
|---|---|---|---|
| Open | Fruth Joseph | $122,477 | |
| Closed | Johnson Joan B | $78,500 | |
| Previous Owner | Millet Anthony K | $63,100 | |
| Closed | Millet Anthony K | $15,800 |
Source: Public Records
Tax History
| Year | Tax Paid | Tax Assessment Tax Assessment Total Assessment is a certain percentage of the fair market value that is determined by local assessors to be the total taxable value of land and additions on the property. | Land | Improvement |
|---|---|---|---|---|
| 2025 | $3,217 | $54,667 | $11,386 | $43,281 |
| 2023 | $3,174 | $54,667 | $11,386 | $43,281 |
| 2022 | $3,033 | $39,547 | $10,129 | $29,418 |
| 2021 | $2,963 | $39,547 | $10,129 | $29,418 |
| 2020 | $3,001 | $39,547 | $10,129 | $29,418 |
| 2019 | $2,847 | $32,956 | $8,442 | $24,514 |
| 2018 | $2,854 | $32,956 | $8,442 | $24,514 |
| 2017 | $2,745 | $32,956 | $8,442 | $24,514 |
| 2016 | $2,677 | $31,480 | $8,894 | $22,586 |
| 2015 | $2,484 | $31,480 | $8,894 | $22,586 |
| 2014 | $2,293 | $31,480 | $8,894 | $22,586 |
| 2013 | $2,364 | $33,139 | $9,363 | $23,776 |
Source: Public Records
Map
Nearby Homes
- 564 Waycross Rd
- 602 Brightview Place Unit 34
- 612 Brightview Place Unit 30
- 614 Brightview Place Unit 29
- 626 Brightview Place Unit 24
- 622 Brightview Place Unit 26
- 620 Brightview Place Unit 27
- 624 Brightview Place Unit 25
- 38 Handel Ln
- 37 Hayden Dr
- 162 Sheffield Rd
- 1013 Ligorio Ave
- 483 Vista Glen Dr
- 16 Japonica Dr
- 10483 Toulon Dr
- 1 Jennings Rd
- 440 W Sharon Rd
- 34 Gambier Cir
- 31 Flanders Ln
- 920 Waycross Rd
- 10616 Chelmsford Rd
- 647 Cascade Rd
- 10626 Chelmsford Rd
- 642 Cascade Rd
- 656 Cascade Rd
- 647 Cranford Dr
- 10636 Chelmsford Rd
- 10582 Chelmsford Rd
- 645 Cascade Rd
- 653 Cascade Rd
- 10617 Chelmsford Rd
- 653 Cranford Dr
- 662 Cascade Rd
- 641 Cascade Rd
- 10646 Chelmsford Rd
- 10627 Chelmsford Rd
- 10574 Chelmsford Rd
- 659 Cranford Dr
- 637 Cascade Rd
- 670 Cascade Rd
Your Personal Tour Guide
Ask me questions while you tour the home.