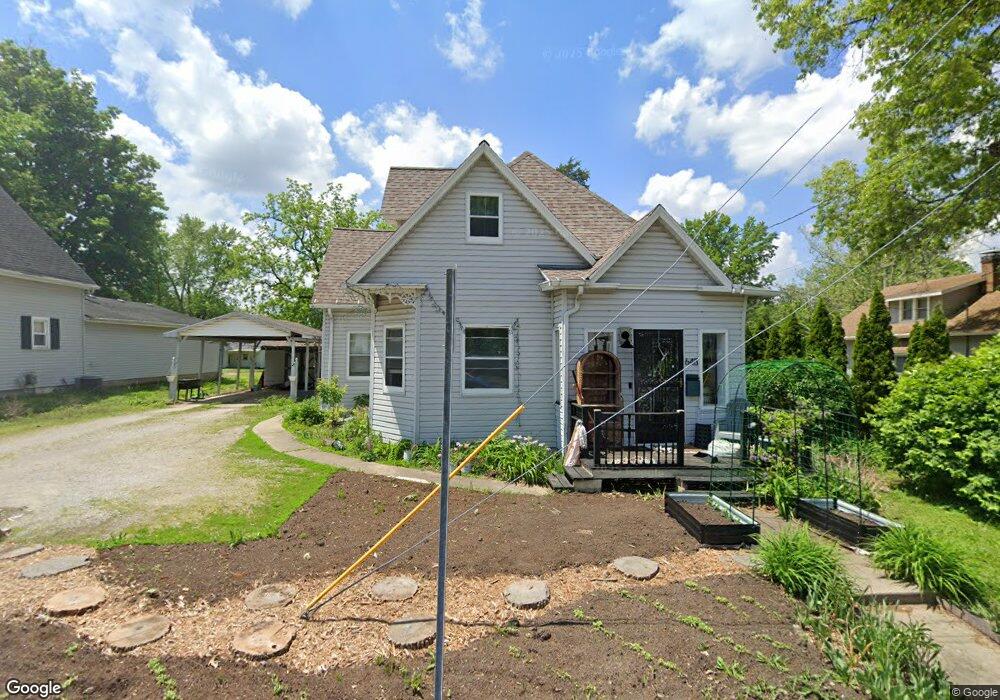
648 Division St Charleston, IL 61920
Estimated Value: $133,000 - $146,147
3
Beds
2
Baths
1,483
Sq Ft
$93/Sq Ft
Est. Value
About This Home
This home is located at 648 Division St, Charleston, IL 61920 and is currently estimated at $137,787, approximately $92 per square foot. 648 Division St is a home located in Coles County with nearby schools including Charleston High School and Charleston Christian Academy.
Ownership History
Date
Name
Owned For
Owner Type
Purchase Details
Closed on
Feb 14, 2022
Sold by
Huston Brian E and Huston Amber
Bought by
Crowe Ashli N
Current Estimated Value
Home Financials for this Owner
Home Financials are based on the most recent Mortgage that was taken out on this home.
Original Mortgage
$91,216
Outstanding Balance
$84,843
Interest Rate
3.69%
Mortgage Type
New Conventional
Estimated Equity
$52,944
Create a Home Valuation Report for This Property
The Home Valuation Report is an in-depth analysis detailing your home's value as well as a comparison with similar homes in the area
Home Values in the Area
Average Home Value in this Area
Purchase History
| Date | Buyer | Sale Price | Title Company |
|---|---|---|---|
| Crowe Ashli N | $93,000 | Warmoth William J |
Source: Public Records
Mortgage History
| Date | Status | Borrower | Loan Amount |
|---|---|---|---|
| Open | Crowe Ashli N | $91,216 |
Source: Public Records
Tax History Compared to Growth
Tax History
| Year | Tax Paid | Tax Assessment Tax Assessment Total Assessment is a certain percentage of the fair market value that is determined by local assessors to be the total taxable value of land and additions on the property. | Land | Improvement |
|---|---|---|---|---|
| 2024 | $2,784 | $35,878 | $2,669 | $33,209 |
| 2023 | $2,742 | $32,765 | $2,437 | $30,328 |
| 2022 | $2,236 | $32,224 | $2,397 | $29,827 |
| 2021 | $1,848 | $25,930 | $2,300 | $23,630 |
| 2020 | $1,875 | $26,866 | $3,789 | $23,077 |
| 2019 | $1,826 | $25,930 | $3,657 | $22,273 |
| 2018 | $1,806 | $25,930 | $3,657 | $22,273 |
| 2017 | $1,783 | $25,930 | $3,657 | $22,273 |
| 2016 | $1,767 | $25,930 | $3,657 | $22,273 |
| 2015 | $1,825 | $25,930 | $3,657 | $22,273 |
| 2014 | $1,825 | $25,930 | $3,657 | $22,273 |
| 2013 | $1,825 | $25,930 | $3,657 | $22,273 |
Source: Public Records
Map
Nearby Homes