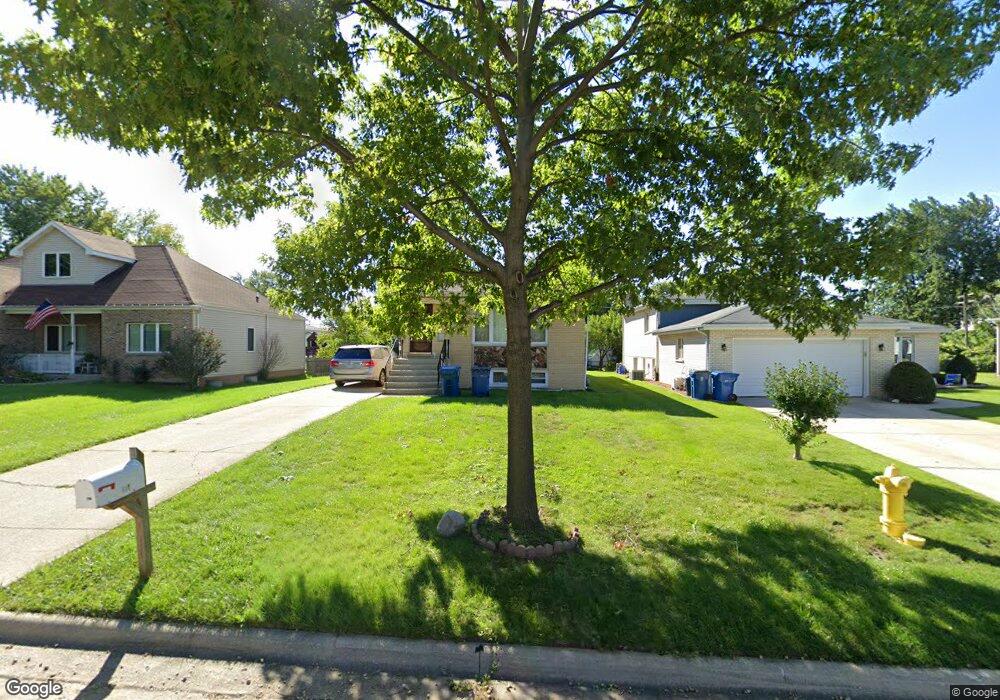
648 N Indiana St Elmhurst, IL 60126
Estimated Value: $390,000 - $480,000
--
Bed
1
Bath
1,350
Sq Ft
$313/Sq Ft
Est. Value
About This Home
This home is located at 648 N Indiana St, Elmhurst, IL 60126 and is currently estimated at $422,973, approximately $313 per square foot. 648 N Indiana St is a home located in DuPage County with nearby schools including Conrad Fischer Elementary School, Churchville Middle School, and York Community High School.
Ownership History
Date
Name
Owned For
Owner Type
Purchase Details
Closed on
Oct 29, 2002
Sold by
Avila Javier and Medina Maria
Bought by
Soppadandi Dayamani
Current Estimated Value
Home Financials for this Owner
Home Financials are based on the most recent Mortgage that was taken out on this home.
Original Mortgage
$240,350
Outstanding Balance
$101,264
Interest Rate
6.1%
Estimated Equity
$321,709
Purchase Details
Closed on
May 25, 2001
Sold by
Avila Javier and Medina Maria
Bought by
Avila Javier and Medina Maria
Purchase Details
Closed on
Dec 1, 2000
Sold by
Donvito Arcangela
Bought by
Avila Javier and Medina Maria
Home Financials for this Owner
Home Financials are based on the most recent Mortgage that was taken out on this home.
Original Mortgage
$218,538
Interest Rate
7.7%
Mortgage Type
FHA
Create a Home Valuation Report for This Property
The Home Valuation Report is an in-depth analysis detailing your home's value as well as a comparison with similar homes in the area
Home Values in the Area
Average Home Value in this Area
Purchase History
| Date | Buyer | Sale Price | Title Company |
|---|---|---|---|
| Soppadandi Dayamani | $253,000 | -- | |
| Avila Javier | -- | -- | |
| Avila Javier | $220,500 | -- |
Source: Public Records
Mortgage History
| Date | Status | Borrower | Loan Amount |
|---|---|---|---|
| Open | Soppadandi Dayamani | $240,350 | |
| Previous Owner | Avila Javier | $218,538 |
Source: Public Records
Tax History Compared to Growth
Tax History
| Year | Tax Paid | Tax Assessment Tax Assessment Total Assessment is a certain percentage of the fair market value that is determined by local assessors to be the total taxable value of land and additions on the property. | Land | Improvement |
|---|---|---|---|---|
| 2024 | $7,063 | $123,334 | $52,671 | $70,663 |
| 2023 | $6,504 | $113,380 | $48,420 | $64,960 |
| 2022 | $6,276 | $108,450 | $46,330 | $62,120 |
| 2021 | $6,003 | $103,880 | $44,380 | $59,500 |
| 2020 | $5,644 | $99,500 | $42,510 | $56,990 |
| 2019 | $5,583 | $95,670 | $40,870 | $54,800 |
| 2018 | $4,847 | $83,390 | $38,920 | $44,470 |
| 2017 | $4,747 | $79,700 | $37,200 | $42,500 |
| 2016 | $4,537 | $73,590 | $34,350 | $39,240 |
| 2015 | $4,436 | $67,980 | $31,730 | $36,250 |
| 2014 | $4,570 | $64,700 | $30,800 | $33,900 |
| 2013 | $4,554 | $66,020 | $31,430 | $34,590 |
Source: Public Records
Map
Nearby Homes
- 634 N Kenilworth Ave
- 281 E North End Ave
- 564 N Adele St
- 791 N Adele St
- 841 N York St Unit 101
- 841 N York St Unit 332
- 841 N York St Unit 129
- 728 N Parker St
- 738 N Parker St
- 3N276 N Howard Ave
- 251 W Armitage Ave
- 183 E Grantley Ave
- 909 N Addison Ave
- 456 N Elm Ave
- 234 E Grantley Ave
- 260 E Grantley Ave
- 3N425 N Howard Ave
- 286 N Indiana St
- 262 N Addison Ave
- 260 N Addison Ave
- 652 N Indiana St
- 644 N Indiana St
- 658 N Indiana St
- 640 N Indiana St
- 647 N Kenilworth Ave
- 651 N Kenilworth Ave
- 641 N Kenilworth Ave
- 655 N Kenilworth Ave
- 664 N Indiana St
- 635 N Kenilworth Ave
- 661 N Kenilworth Ave
- 659 N Indiana St
- 653 N Indiana St
- 636 N Indiana St
- 668 N Indiana St
- 649 N Indiana St
- 633 N Kenilworth Ave
- 663 N Indiana St
- 645 N Indiana St
- 667 N Kenilworth Ave