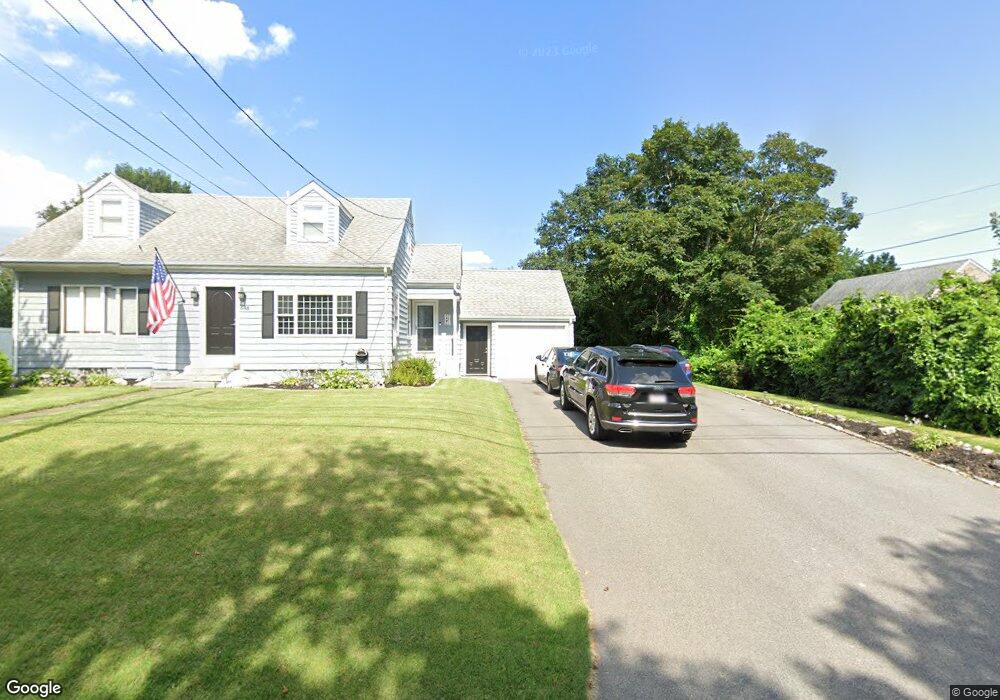
648 Sanford Rd Westport, MA 02790
North Westport NeighborhoodEstimated Value: $497,000 - $632,000
3
Beds
2
Baths
2,200
Sq Ft
$249/Sq Ft
Est. Value
About This Home
This home is located at 648 Sanford Rd, Westport, MA 02790 and is currently estimated at $548,607, approximately $249 per square foot. 648 Sanford Rd is a home located in Bristol County with nearby schools including Alice A. Macomber Primary School, Westport Elementary School, and Westport Middle-High School.
Ownership History
Date
Name
Owned For
Owner Type
Purchase Details
Closed on
Jun 29, 2007
Sold by
Ford Elizabeth and Rogers Joseph
Bought by
Girard David G and Girard Kerry
Current Estimated Value
Home Financials for this Owner
Home Financials are based on the most recent Mortgage that was taken out on this home.
Original Mortgage
$215,000
Interest Rate
6.24%
Mortgage Type
Purchase Money Mortgage
Purchase Details
Closed on
Jun 9, 2003
Sold by
Raposo Cynthia A
Bought by
Ford Elizabeth and Rogers Joseph
Create a Home Valuation Report for This Property
The Home Valuation Report is an in-depth analysis detailing your home's value as well as a comparison with similar homes in the area
Home Values in the Area
Average Home Value in this Area
Purchase History
| Date | Buyer | Sale Price | Title Company |
|---|---|---|---|
| Girard David G | $300,000 | -- | |
| Ford Elizabeth | $200,000 | -- |
Source: Public Records
Mortgage History
| Date | Status | Borrower | Loan Amount |
|---|---|---|---|
| Open | Ford Elizabeth | $239,700 | |
| Closed | Ford Elizabeth | $219,000 | |
| Closed | Ford Elizabeth | $215,000 |
Source: Public Records
Tax History Compared to Growth
Tax History
| Year | Tax Paid | Tax Assessment Tax Assessment Total Assessment is a certain percentage of the fair market value that is determined by local assessors to be the total taxable value of land and additions on the property. | Land | Improvement |
|---|---|---|---|---|
| 2025 | $2,836 | $380,700 | $165,400 | $215,300 |
| 2024 | $2,765 | $357,700 | $146,900 | $210,800 |
| 2023 | $2,740 | $335,800 | $133,800 | $202,000 |
| 2022 | $2,597 | $306,200 | $133,800 | $172,400 |
| 2021 | $2,439 | $283,000 | $110,600 | $172,400 |
| 2020 | $2,349 | $278,600 | $106,200 | $172,400 |
| 2019 | $2,247 | $271,700 | $106,200 | $165,500 |
| 2018 | $2,078 | $254,300 | $107,000 | $147,300 |
| 2017 | $2,020 | $253,400 | $103,600 | $149,800 |
| 2016 | $1,928 | $243,700 | $100,200 | $143,500 |
| 2015 | $1,909 | $240,700 | $102,500 | $138,200 |
Source: Public Records
Map
Nearby Homes