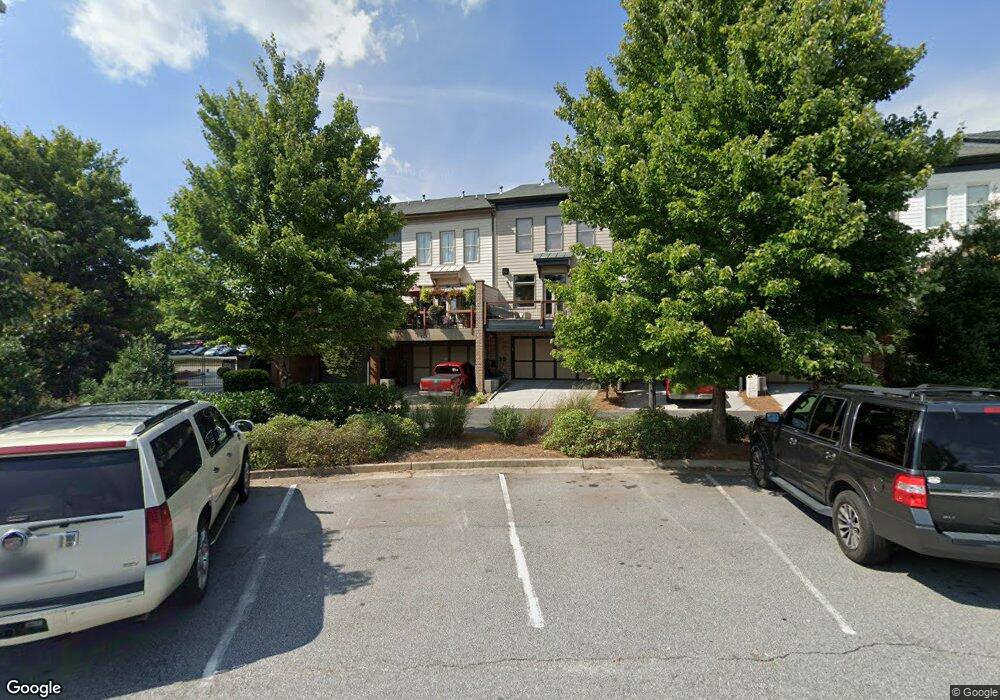
648 Village Park Dr NW Unit 5 Kennesaw, GA 30144
Estimated Value: $462,209 - $503,000
2
Beds
4
Baths
2,004
Sq Ft
$241/Sq Ft
Est. Value
About This Home
This home is located at 648 Village Park Dr NW Unit 5, Kennesaw, GA 30144 and is currently estimated at $482,802, approximately $240 per square foot. 648 Village Park Dr NW Unit 5 is a home located in Cobb County with nearby schools including Pitner Elementary School, Palmer Middle School, and Kell High School.
Ownership History
Date
Name
Owned For
Owner Type
Purchase Details
Closed on
May 5, 2017
Sold by
Griffith Wanda S
Bought by
Griffith Wanda
Current Estimated Value
Purchase Details
Closed on
Feb 16, 2015
Sold by
Kennesaw Townpark Partners Llc
Bought by
Dj Arrow Townpark Llc and C/O Arrowhead Real Estate Part
Purchase Details
Closed on
Jan 29, 2010
Sold by
Land South Of Charleston Inc
Bought by
Griffith Wanda S
Home Financials for this Owner
Home Financials are based on the most recent Mortgage that was taken out on this home.
Original Mortgage
$183,582
Interest Rate
5.16%
Mortgage Type
New Conventional
Purchase Details
Closed on
Sep 29, 2009
Sold by
Bank Of North Ga
Bought by
Land South Of Charleston Llc
Create a Home Valuation Report for This Property
The Home Valuation Report is an in-depth analysis detailing your home's value as well as a comparison with similar homes in the area
Home Values in the Area
Average Home Value in this Area
Purchase History
| Date | Buyer | Sale Price | Title Company |
|---|---|---|---|
| Griffith Wanda | -- | -- | |
| Dj Arrow Townpark Llc | $766,500 | -- | |
| Griffith Wanda S | $204,000 | -- | |
| Land South Of Charleston Llc | $154,000 | -- |
Source: Public Records
Mortgage History
| Date | Status | Borrower | Loan Amount |
|---|---|---|---|
| Previous Owner | Griffith Wanda S | $183,582 |
Source: Public Records
Tax History Compared to Growth
Tax History
| Year | Tax Paid | Tax Assessment Tax Assessment Total Assessment is a certain percentage of the fair market value that is determined by local assessors to be the total taxable value of land and additions on the property. | Land | Improvement |
|---|---|---|---|---|
| 2025 | $4,029 | $174,784 | $36,000 | $138,784 |
| 2024 | $3,794 | $163,792 | $28,000 | $135,792 |
| 2023 | $3,252 | $163,792 | $28,000 | $135,792 |
| 2022 | $3,237 | $136,900 | $28,000 | $108,900 |
| 2021 | $3,106 | $130,956 | $28,000 | $102,956 |
| 2020 | $2,685 | $111,704 | $24,000 | $87,704 |
| 2019 | $2,685 | $111,704 | $24,000 | $87,704 |
| 2018 | $2,505 | $103,492 | $26,000 | $77,492 |
| 2017 | $2,429 | $103,492 | $26,000 | $77,492 |
| 2016 | $2,391 | $101,492 | $24,000 | $77,492 |
| 2015 | $2,192 | $90,448 | $20,000 | $70,448 |
| 2014 | $1,969 | $79,836 | $0 | $0 |
Source: Public Records
Map
Nearby Homes
- 3331 Chastain Gardens Dr NW
- 3642 Southwick Dr NW
- 3316 Chastain Gardens Dr NW
- 394 Ethridge Dr NW
- 127 N Lakeside Dr NW
- 733 Creek Trail NW
- 400 Vinca Cir NW
- 3983 Cripple Creek Dr NW
- 157 Eastlake Point NW
- Milan Plan at The Reserve at Bells Ferry - The Reserve at Bells Ferry - Active Adult
- Venice Plan at The Reserve at Bells Ferry - The Reserve at Bells Ferry - Active Adult
- Florence Plan at The Reserve at Bells Ferry - The Reserve at Bells Ferry - Active Adult
- Naples Plan at The Reserve at Bells Ferry - The Reserve at Bells Ferry - Active Adult
- 936 Shiloh Ridge Run NW
- 520 Fescue Ct
- 199 Vinca Cir NW
- 220 Vinca Cir NW
- 175 Plaza Park Walk Unit 2
- 4164 Little Springs NW
- 487 Fescue Ct
- 648 Village Park Dr NW Unit 32
- 644 Village Park Dr NW Unit 5
- 652 Village Park Dr NW Unit 5
- 652 Village Park Dr NW
- 640 Village Park Dr NW Unit 5
- 636 Village Park Dr NW
- 632 Village Park Dr NW Unit 5
- 632 Village Park Dr NW
- 628 Village Park Dr NW Unit 5
- 576 Townpark Ln NW
- 624 Village Park Dr NW Unit 5
- 624 Village Park Dr NW
- 572 Townpark Ln NW
- 614 Village Park Dr NW Unit 25
- 614 Village Park Dr NW Unit 4
- 610 Village Park Dr NW Unit 24
- 610 Village Park Dr NW
- 606 Village Park Dr NW Unit 4
- 606 Village Park Dr NW Unit 23
- 556 Townpark Ln NW