6481 Big Run Rd Georgetown, OH 45121
Estimated Value: $465,000 - $1,032,000
3
Beds
2
Baths
2,104
Sq Ft
$399/Sq Ft
Est. Value
About This Home
This home is located at 6481 Big Run Rd, Georgetown, OH 45121 and is currently estimated at $840,334, approximately $399 per square foot. 6481 Big Run Rd is a home located in Brown County with nearby schools including Georgetown Elementary School and Georgetown Jr/Sr High School.
Ownership History
Date
Name
Owned For
Owner Type
Purchase Details
Closed on
Nov 19, 2024
Bought by
Damen Shawn and Damen Jennifer
Current Estimated Value
Home Financials for this Owner
Home Financials are based on the most recent Mortgage that was taken out on this home.
Original Mortgage
$794,750
Outstanding Balance
$784,408
Interest Rate
6.54%
Mortgage Type
New Conventional
Estimated Equity
$55,926
Purchase Details
Closed on
Jul 10, 2023
Sold by
Chaney Dennis K and Chaney Rhonda G
Bought by
Richard Colwell Living Trust
Purchase Details
Closed on
Jul 15, 2011
Sold by
Day Charles W and Day Mary A
Bought by
Chaney Dennis K and Chaney Rhonda G
Purchase Details
Closed on
Dec 9, 1998
Sold by
Purdy Lewis R
Bought by
Day Charles W and Day Mary A
Home Financials for this Owner
Home Financials are based on the most recent Mortgage that was taken out on this home.
Original Mortgage
$127,350
Interest Rate
6.63%
Mortgage Type
New Conventional
Create a Home Valuation Report for This Property
The Home Valuation Report is an in-depth analysis detailing your home's value as well as a comparison with similar homes in the area
Purchase History
| Date | Buyer | Sale Price | Title Company |
|---|---|---|---|
| Damen Shawn | $935,000 | None Listed On Document | |
| Richard Colwell Living Trust | $934,250 | None Listed On Document | |
| Chaney Dennis K | -- | None Available | |
| Day Charles W | $160,000 | -- |
Source: Public Records
Mortgage History
| Date | Status | Borrower | Loan Amount |
|---|---|---|---|
| Open | Damen Shawn | $794,750 | |
| Previous Owner | Day Charles W | $127,350 |
Source: Public Records
Tax History
| Year | Tax Paid | Tax Assessment Tax Assessment Total Assessment is a certain percentage of the fair market value that is determined by local assessors to be the total taxable value of land and additions on the property. | Land | Improvement |
|---|---|---|---|---|
| 2024 | $5,300 | $316,610 | $161,350 | $155,260 |
| 2023 | $5,406 | $144,380 | $64,780 | $79,600 |
| 2022 | $2,986 | $144,380 | $64,780 | $79,600 |
| 2021 | $2,955 | $144,380 | $64,780 | $79,600 |
| 2020 | $2,773 | $125,550 | $56,330 | $69,220 |
| 2019 | $1,632 | $125,550 | $56,330 | $69,220 |
| 2018 | $2,686 | $82,390 | $14,350 | $68,040 |
| 2017 | $2,421 | $73,230 | $17,710 | $55,520 |
| 2016 | $2,419 | $73,230 | $17,710 | $55,520 |
| 2015 | $2,320 | $73,230 | $17,710 | $55,520 |
| 2014 | $2,320 | $67,630 | $12,110 | $55,520 |
| 2013 | $2,142 | $67,630 | $12,110 | $55,520 |
Source: Public Records
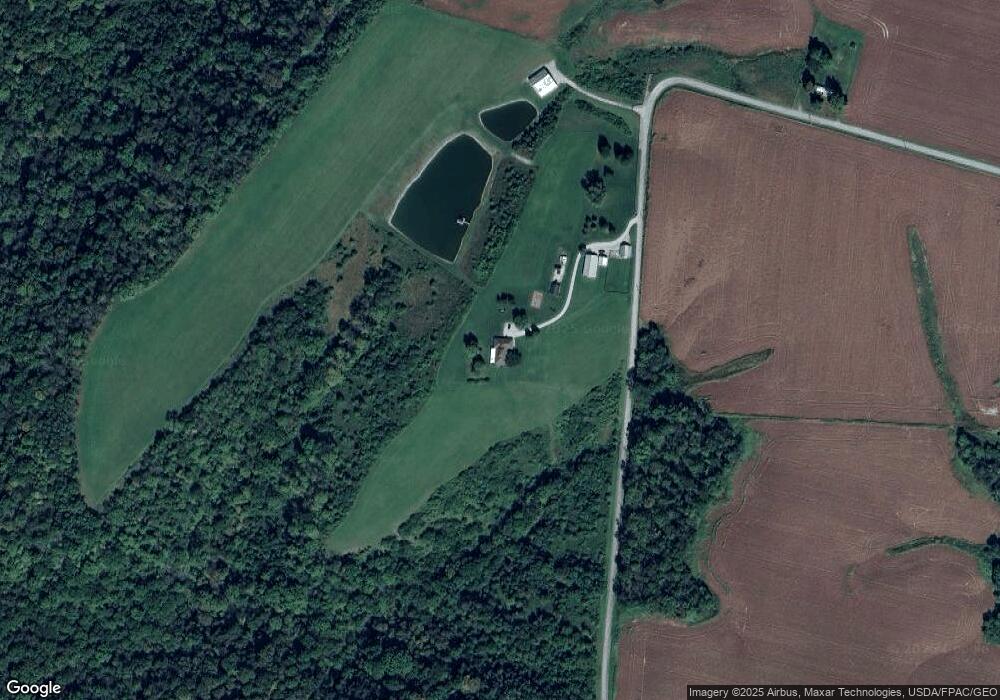
Map
Nearby Homes
- 3465 Loudon Rd
- 7029 Free Soil Rd
- 208 Main St
- 308 Jackson St
- 2845 Mary Ingles Hwy E
- 20 Heritage Hill Dr
- 0 St Rt 221 & Footbridge Unit 1826509
- 5173 Old A & P
- 38 Dell Acres Dr
- 155 Free Soil Rd
- 175 Douglas Cir
- 510 W State St
- 505 S Water St
- 2326 Eden Rd
- 200 N High St
- ac Shinkle Ridge Rd
- 405 N Main St
- 666 E State St
- 406 E North St
- 508 E 3rd St
- 6359 Big Run Rd
- 6339 Big Run Rd
- 11 Shaw Rd
- 6307 White Oak Ln
- 6321 White Oak Ln
- 0 Big Run Rd Unit 1087207
- 0 Big Run Rd Unit 1023055
- 0 Big Run Rd Unit 957783
- 0 Big Run Rd Unit 935609
- 0 Big Run Rd Unit 644558
- 0 Big Run Rd Unit 1647083
- 6311 Big Run Rd
- 16 White Oak Ln
- 6276 White Oak Ln
- 3485 Loudon Rd
- 3485 Loudon Rd
- 6243 Big Run Rd
- 3423 Loudon Rd
- 6291 Red Oak Dr
- 6264 Red Oak Dr
Your Personal Tour Guide
Ask me questions while you tour the home.