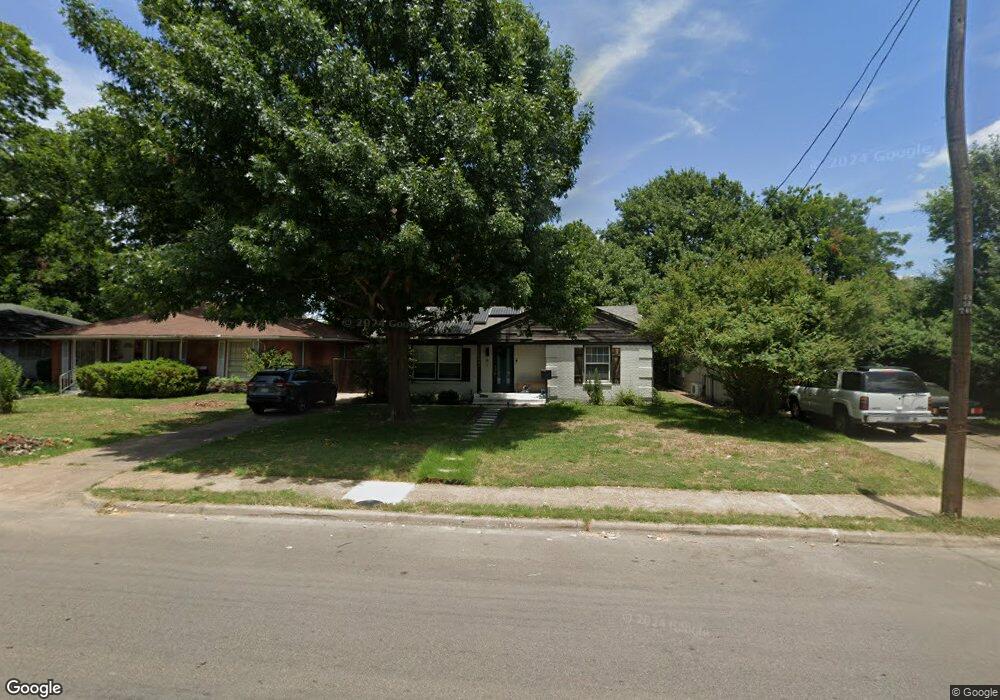
6481 Fisher Rd Dallas, TX 75214
Northeast Dallas NeighborhoodEstimated Value: $428,292 - $521,000
2
Beds
1
Bath
1,110
Sq Ft
$444/Sq Ft
Est. Value
About This Home
This home is located at 6481 Fisher Rd, Dallas, TX 75214 and is currently estimated at $492,823, approximately $443 per square foot. 6481 Fisher Rd is a home located in Dallas County with nearby schools including Dan D Rogers Elementary School, Benjamin Franklin International Exploratory Academy, and Hillcrest High School.
Ownership History
Date
Name
Owned For
Owner Type
Purchase Details
Closed on
Apr 16, 2018
Sold by
Richamond Lanbeth Llc
Bought by
Morcom David Christian
Current Estimated Value
Home Financials for this Owner
Home Financials are based on the most recent Mortgage that was taken out on this home.
Original Mortgage
$300,603
Outstanding Balance
$258,453
Interest Rate
4.43%
Mortgage Type
New Conventional
Estimated Equity
$234,370
Purchase Details
Closed on
Oct 31, 2017
Sold by
Brombeg Capital Investments Llc
Bought by
Richmond Lambeth Llc
Home Financials for this Owner
Home Financials are based on the most recent Mortgage that was taken out on this home.
Original Mortgage
$230,000
Interest Rate
3.83%
Mortgage Type
Purchase Money Mortgage
Purchase Details
Closed on
Jul 10, 2017
Sold by
Bromberg Debra
Bought by
Bromberg Capital Investments Llc
Create a Home Valuation Report for This Property
The Home Valuation Report is an in-depth analysis detailing your home's value as well as a comparison with similar homes in the area
Home Values in the Area
Average Home Value in this Area
Purchase History
| Date | Buyer | Sale Price | Title Company |
|---|---|---|---|
| Morcom David Christian | -- | Capital Title | |
| Richmond Lambeth Llc | -- | Capital Title | |
| Bromberg Capital Investments Llc | -- | None Available |
Source: Public Records
Mortgage History
| Date | Status | Borrower | Loan Amount |
|---|---|---|---|
| Open | Morcom David Christian | $300,603 | |
| Previous Owner | Richmond Lambeth Llc | $230,000 |
Source: Public Records
Tax History Compared to Growth
Tax History
| Year | Tax Paid | Tax Assessment Tax Assessment Total Assessment is a certain percentage of the fair market value that is determined by local assessors to be the total taxable value of land and additions on the property. | Land | Improvement |
|---|---|---|---|---|
| 2025 | $5,624 | $407,560 | $289,660 | $117,900 |
| 2024 | $5,624 | $364,340 | $140,000 | $224,340 |
| 2023 | $5,624 | $318,840 | $94,500 | $224,340 |
| 2022 | $7,972 | $318,840 | $94,500 | $224,340 |
| 2021 | $8,316 | $315,240 | $94,500 | $220,740 |
| 2020 | $8,552 | $315,230 | $94,500 | $220,730 |
| 2019 | $8,969 | $315,230 | $94,500 | $220,730 |
| 2018 | $6,196 | $227,850 | $94,500 | $133,350 |
| 2017 | $4,855 | $178,550 | $94,500 | $84,050 |
| 2016 | $4,855 | $178,550 | $94,500 | $84,050 |
| 2015 | $2,834 | $115,580 | $47,250 | $68,330 |
| 2014 | $2,834 | $103,330 | $35,000 | $68,330 |
Source: Public Records
Map
Nearby Homes
- 6546 E Lovers Ln
- 6517 Highgate Ln
- 6646 E Lovers Ln Unit 602
- 6646 E Lovers Ln Unit 808
- 6646 E Lovers Ln Unit 501
- 6646 E Lovers Ln Unit 702
- 6646 E Lovers Ln Unit 301
- 6646 E Lovers Ln Unit 1308
- 6646 E Lovers Ln Unit 1201
- 6611 Highgate Ln
- 6333 Town Hill Ln
- 6327 Town Hill Ln
- 6350 Glennox Ln
- 6431 Dunstan Ln
- 6349 Highgate Ln
- 6717 Pimlico Dr
- 6665 Santa Anita Dr
- 6754 E Northwest Hwy
- 6742 E Northwest Hwy
- 6527 Axton Cir
- 6485 Fisher Rd
- 6477 Fisher Rd
- 6473 Fisher Rd
- 6489 Fisher Rd
- 6480 Lontos Dr
- 6478 Lontos Dr Unit 6480
- 6474 Lontos Dr
- 6482 Lontos Dr
- 6503 E Lovers Ln
- 6484 Fisher Rd
- 6486 Lontos Dr
- 6470 Lontos Dr
- 6509 E Lovers Ln
- 6488 Fisher Rd
- 6480 Fisher Rd
- 6484 Lontos Dr
- 6463 Fisher Rd
- 6492 Fisher Rd
- 6476 Fisher Rd
- 6492 Lontos Dr