Estimated Value: $91,000 - $136,772
3
Beds
1
Bath
1,448
Sq Ft
$81/Sq Ft
Est. Value
About This Home
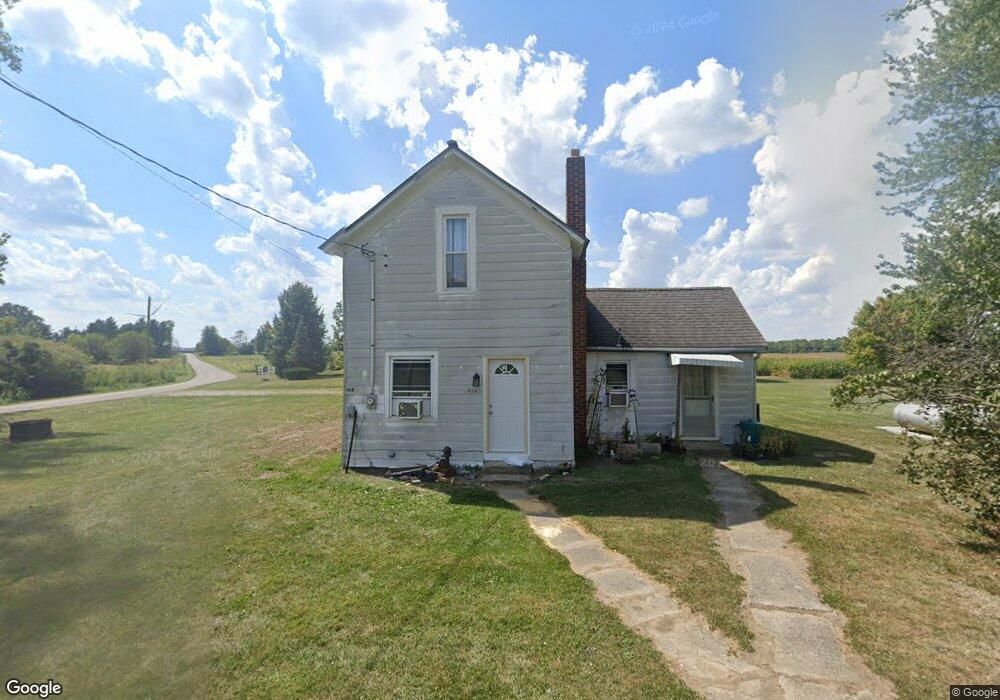
This home is located at 6484 S 510 W, Modoc, IN 47358 and is currently estimated at $117,693, approximately $81 per square foot. 6484 S 510 W is a home located in Randolph County with nearby schools including Union Elementary School, Indiana Digital Learning School - Jr. & High School, and Union Junior/Senior High School.
Ownership History
Date
Name
Owned For
Owner Type
Purchase Details
Closed on
Sep 13, 2014
Sold by
Gentilcore Dylan Anthony and Swafford Judy K
Bought by
Bates Jarrett J
Current Estimated Value
Home Financials for this Owner
Home Financials are based on the most recent Mortgage that was taken out on this home.
Original Mortgage
$40,375
Outstanding Balance
$30,696
Interest Rate
4.11%
Mortgage Type
New Conventional
Estimated Equity
$86,997
Purchase Details
Closed on
Nov 15, 2005
Sold by
Gentilcore Patrick and Gentilcore Judy
Bought by
Gentilcore Dylan Anthony
Purchase Details
Closed on
Sep 12, 2005
Sold by
Weston Phillip H
Bought by
Core Patrick Gentil and Gentilcore Judy
Create a Home Valuation Report for This Property
The Home Valuation Report is an in-depth analysis detailing your home's value as well as a comparison with similar homes in the area
Home Values in the Area
Average Home Value in this Area
Purchase History
| Date | Buyer | Sale Price | Title Company |
|---|---|---|---|
| Bates Jarrett J | -- | None Available | |
| Gentilcore Dylan Anthony | -- | None Available | |
| Core Patrick Gentil | -- | None Available |
Source: Public Records
Mortgage History
| Date | Status | Borrower | Loan Amount |
|---|---|---|---|
| Open | Bates Jarrett J | $40,375 |
Source: Public Records
Tax History Compared to Growth
Tax History
| Year | Tax Paid | Tax Assessment Tax Assessment Total Assessment is a certain percentage of the fair market value that is determined by local assessors to be the total taxable value of land and additions on the property. | Land | Improvement |
|---|---|---|---|---|
| 2024 | $345 | $82,200 | $13,400 | $68,800 |
| 2023 | $346 | $84,100 | $13,400 | $70,700 |
| 2022 | $370 | $83,700 | $13,400 | $70,300 |
| 2021 | $319 | $62,500 | $12,500 | $50,000 |
| 2020 | $323 | $62,700 | $12,500 | $50,200 |
| 2019 | $298 | $63,400 | $12,500 | $50,900 |
| 2018 | $292 | $63,600 | $12,500 | $51,100 |
| 2017 | $244 | $58,300 | $12,500 | $45,800 |
| 2016 | $197 | $58,600 | $12,500 | $46,100 |
| 2014 | $80 | $40,300 | $13,000 | $27,300 |
| 2013 | $80 | $39,100 | $13,000 | $26,100 |
Source: Public Records
Map
Nearby Homes
- 9*** S 800 W
- 9*** County Road 800 W
- 3432 S Indian Trail
- 219 S Main St
- 3346 SE Indian Trail Lake Rd
- 274 4th St
- 1820 E 700 S
- 501 W Sherman St
- 425 S 1200 W
- 1041 S Huntsville Rd
- 410 N Main St
- 1033 S Huntsville Rd
- 28 Stonebridge Dr
- 400 S 1200 W
- Lot 5 Huntsville Rd
- 712 Wedgewood Dr
- 803 S Beeson Dr
- 742 S Huntsville Rd
- 315 W Orange St
- 2980 S 225 E