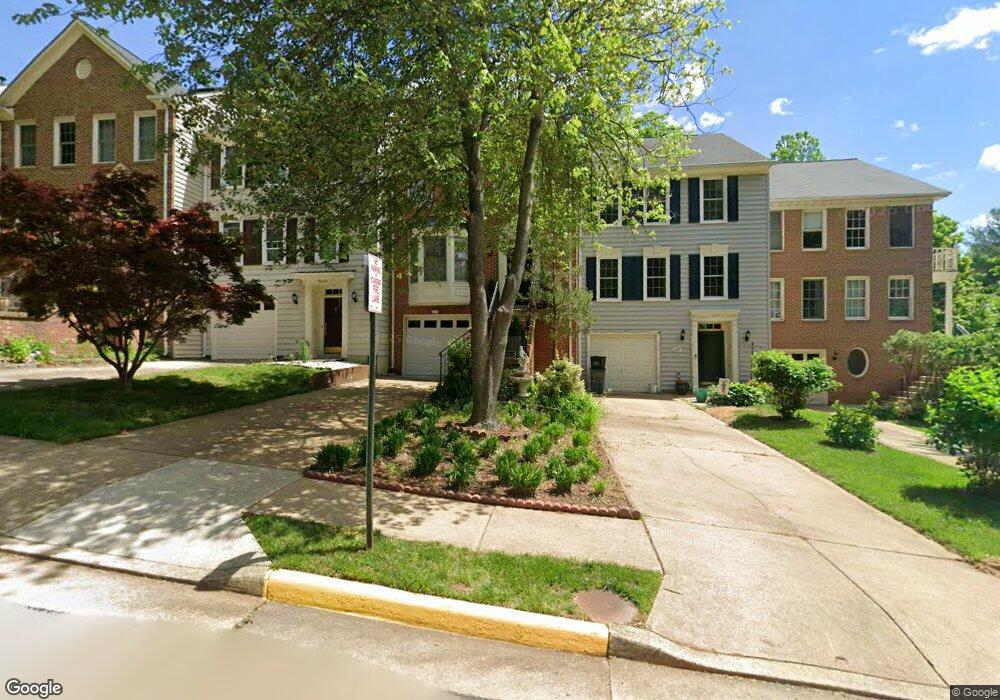
6485 English Ivy Ct Springfield, VA 22152
Estimated Value: $675,772 - $714,000
3
Beds
4
Baths
1,596
Sq Ft
$438/Sq Ft
Est. Value
About This Home
This home is located at 6485 English Ivy Ct, Springfield, VA 22152 and is currently estimated at $698,693, approximately $437 per square foot. 6485 English Ivy Ct is a home located in Fairfax County with nearby schools including Rolling Valley Elementary School, Irving Middle School, and West Springfield High School.
Ownership History
Date
Name
Owned For
Owner Type
Purchase Details
Closed on
Sep 14, 2006
Sold by
Pham Ngoc K
Bought by
Zailah Michel
Current Estimated Value
Home Financials for this Owner
Home Financials are based on the most recent Mortgage that was taken out on this home.
Original Mortgage
$175,000
Outstanding Balance
$105,323
Interest Rate
6.71%
Mortgage Type
New Conventional
Estimated Equity
$593,370
Purchase Details
Closed on
Jun 19, 2002
Sold by
Park Jin
Bought by
Phan Ngoc and Nguyen,Hang
Home Financials for this Owner
Home Financials are based on the most recent Mortgage that was taken out on this home.
Original Mortgage
$239,200
Interest Rate
6.81%
Mortgage Type
New Conventional
Purchase Details
Closed on
Oct 25, 1996
Sold by
Savidge Donald H
Bought by
Park Jin S
Home Financials for this Owner
Home Financials are based on the most recent Mortgage that was taken out on this home.
Original Mortgage
$147,000
Interest Rate
8.22%
Create a Home Valuation Report for This Property
The Home Valuation Report is an in-depth analysis detailing your home's value as well as a comparison with similar homes in the area
Home Values in the Area
Average Home Value in this Area
Purchase History
| Date | Buyer | Sale Price | Title Company |
|---|---|---|---|
| Zailah Michel | $450,000 | -- | |
| Phan Ngoc | $299,900 | -- | |
| Park Jin S | $197,000 | -- |
Source: Public Records
Mortgage History
| Date | Status | Borrower | Loan Amount |
|---|---|---|---|
| Open | Zailah Michel | $175,000 | |
| Previous Owner | Phan Ngoc | $239,200 | |
| Previous Owner | Park Jin S | $147,000 |
Source: Public Records
Tax History Compared to Growth
Tax History
| Year | Tax Paid | Tax Assessment Tax Assessment Total Assessment is a certain percentage of the fair market value that is determined by local assessors to be the total taxable value of land and additions on the property. | Land | Improvement |
|---|---|---|---|---|
| 2025 | $6,983 | $644,700 | $200,000 | $444,700 |
| 2024 | $6,983 | $602,770 | $190,000 | $412,770 |
| 2023 | $6,615 | $586,200 | $185,000 | $401,200 |
| 2022 | $6,471 | $565,920 | $175,000 | $390,920 |
| 2021 | $5,923 | $504,730 | $150,000 | $354,730 |
| 2020 | $5,468 | $462,010 | $140,000 | $322,010 |
| 2019 | $5,468 | $462,010 | $140,000 | $322,010 |
| 2018 | $4,977 | $432,740 | $140,000 | $292,740 |
| 2017 | $4,910 | $422,870 | $135,000 | $287,870 |
| 2016 | $4,899 | $422,870 | $135,000 | $287,870 |
| 2015 | $4,719 | $422,870 | $135,000 | $287,870 |
| 2014 | $4,510 | $405,040 | $125,000 | $280,040 |
Source: Public Records
Map
Nearby Homes
- 6410 Wyngate Dr
- 8444 Millwood Dr
- 6403 Velliety Ln
- 6500 Rivington Rd
- 6355 Regal Oak Dr
- 6606 Huntsman Blvd
- 8674 Center Rd Unit 1
- 6163 Forest Creek Ln
- 6465 Blarney Stone Ct
- 8590 Beatrice Ct
- 6143 Green Hollow Ct
- 8623 James Creek Dr
- 6801 Houndmaster Rd
- 6427 Old Scotts Ct
- 6010 Timber Hollow Ln
- 6710 Red Jacket Rd
- 8120 Greeley Blvd
- 8518 Fairburn Dr
- 6260 Rathlin Dr
- 5944 Queenston St
- 6487 English Ivy Ct
- 6483 English Ivy Ct
- 6481 English Ivy Ct
- 6489 English Ivy Ct
- 6479 English Ivy Ct
- 6477 English Ivy Ct
- 6475 English Ivy Ct
- 6451 English Ivy Ct
- 6453 English Ivy Ct
- 6449 English Ivy Ct
- 6455 English Ivy Ct
- 6457 English Ivy Ct
- 6447 English Ivy Ct
- 8618 Greeley Blvd
- 8618 Greeley Blvd Unit 2
- 6445 English Ivy Ct
- 8485 Old Keene Mill Rd
- 6443 English Ivy Ct
- 6495 English Ivy Ct
- 6495 Engish Ivy Ct