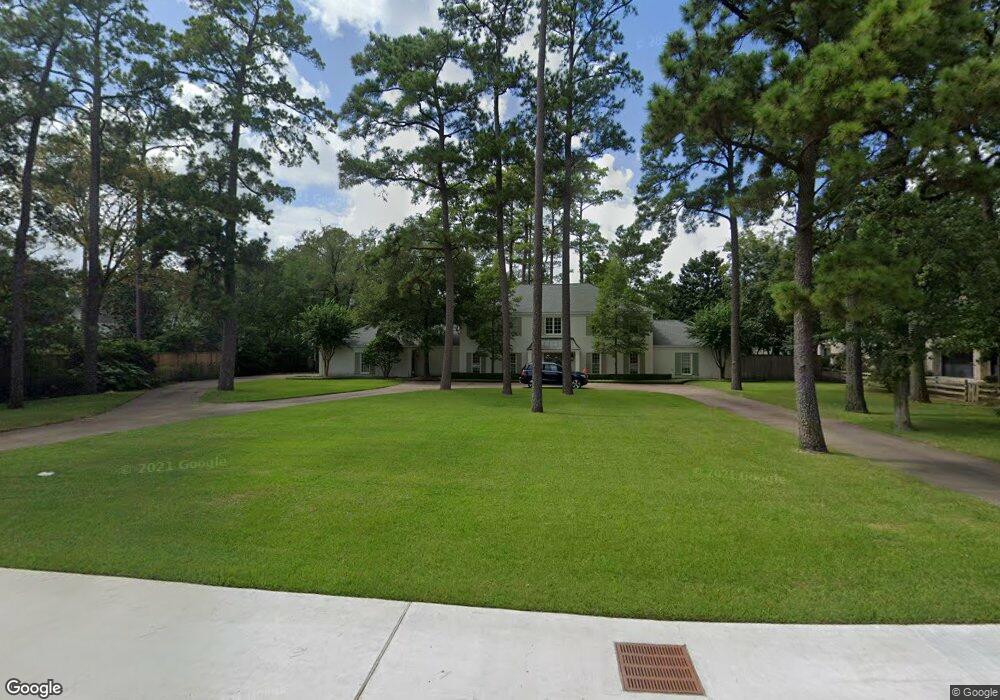
649 Bunker Hill Rd Houston, TX 77024
Estimated Value: $2,945,000 - $3,303,000
5
Beds
7
Baths
5,253
Sq Ft
$605/Sq Ft
Est. Value
About This Home
This home is located at 649 Bunker Hill Rd, Houston, TX 77024 and is currently estimated at $3,177,371, approximately $604 per square foot. 649 Bunker Hill Rd is a home located in Harris County with nearby schools including Bunker Hill Elementary School, Memorial Middle, and Memorial High School.
Ownership History
Date
Name
Owned For
Owner Type
Purchase Details
Closed on
Feb 1, 2012
Sold by
Cemex Management Inc
Bought by
Crow Carter C and Crow Meredith M
Current Estimated Value
Home Financials for this Owner
Home Financials are based on the most recent Mortgage that was taken out on this home.
Original Mortgage
$1,340,800
Outstanding Balance
$914,552
Interest Rate
3.95%
Mortgage Type
New Conventional
Estimated Equity
$2,262,819
Purchase Details
Closed on
Dec 12, 1998
Sold by
Pullen Jeffrey A and Pullen Debora K
Bought by
Cemex Usa Management Inc
Purchase Details
Closed on
Jul 15, 1997
Sold by
Mcdaniel Jarrel D and Mcdaniel Anne L
Bought by
Pullen Jeffrey A and Pullen Debora K
Home Financials for this Owner
Home Financials are based on the most recent Mortgage that was taken out on this home.
Original Mortgage
$516,000
Interest Rate
7.85%
Create a Home Valuation Report for This Property
The Home Valuation Report is an in-depth analysis detailing your home's value as well as a comparison with similar homes in the area
Home Values in the Area
Average Home Value in this Area
Purchase History
| Date | Buyer | Sale Price | Title Company |
|---|---|---|---|
| Crow Carter C | -- | Old Republic National Title | |
| Crow Carter C | -- | Old Republic National Title | |
| Cemex Usa Management Inc | -- | Houston Title Company 700 | |
| Pullen Jeffrey A | -- | First American Title |
Source: Public Records
Mortgage History
| Date | Status | Borrower | Loan Amount |
|---|---|---|---|
| Open | Crow Carter C | $1,340,800 | |
| Closed | Crow Carter C | $1,340,800 | |
| Previous Owner | Pullen Jeffrey A | $516,000 |
Source: Public Records
Tax History Compared to Growth
Tax History
| Year | Tax Paid | Tax Assessment Tax Assessment Total Assessment is a certain percentage of the fair market value that is determined by local assessors to be the total taxable value of land and additions on the property. | Land | Improvement |
|---|---|---|---|---|
| 2025 | $49,046 | $3,398,646 | $1,786,770 | $1,611,876 |
| 2024 | $49,046 | $3,095,733 | $1,727,211 | $1,368,522 |
| 2023 | $49,046 | $2,981,926 | $1,637,873 | $1,344,053 |
| 2022 | $55,952 | $2,930,521 | $1,637,873 | $1,292,648 |
| 2021 | $52,979 | $2,493,009 | $1,548,534 | $944,475 |
| 2020 | $49,253 | $2,223,929 | $1,548,534 | $675,395 |
| 2019 | $53,775 | $2,331,281 | $1,548,534 | $782,747 |
| 2018 | $11,687 | $2,300,000 | $1,548,534 | $751,466 |
| 2017 | $51,807 | $2,300,000 | $1,548,534 | $751,466 |
| 2016 | $47,097 | $2,300,000 | $1,548,534 | $751,466 |
| 2015 | $45,870 | $2,300,000 | $1,548,534 | $751,466 |
| 2014 | $45,870 | $1,982,853 | $1,340,078 | $642,775 |
Source: Public Records
Map
Nearby Homes
- 11718 Broken Bough Cir
- 711 Timber Hill Dr
- 9 Leisure Ln
- 11910 Heritage Ln
- 11706 Flintwood Dr
- 12 Gage Ct
- 517 Flintdale Rd
- 4 Blalock Woods St
- 11729 Joan of Arc Dr
- 826 Bunker Hill Rd
- 11607 Barazi Oaks Ct
- 827 Bunker Hill Rd
- 835 Merridel Rd
- 11801 Barryknoll Ln
- 601 Strey Ln
- 2 Blalock Pines Ct
- 11905 Barryknoll Ln
- 902 Memorial Village Dr Unit 66
- 939 Memorial Village Dr Unit 38
- 12003 Tall Oaks St
- 653 Bunker Hill Rd
- 11802 Cobblestone Dr
- 11810 Cobblestone Dr
- 11727 Broken Bough Cir
- 66 Williamsburg Ln
- 70 Williamsburg Ln
- 657 Bunker Hill Rd
- 11726 Broken Bough Cir
- 11818 Cobblestone Dr
- 78 Williamsburg Ln
- 11726 Cobblestone Dr
- 11719 Broken Bough Cir
- 11803 Cobblestone Dr
- 673 Bunker Hill Rd
- 668 Bunker Hill Rd
- 11811 Cobblestone Dr
- 82 Williamsburg Ln
- 11720 Cobblestone Dr
- 11715 Broken Bough Cir
- 11819 Cobblestone Dr