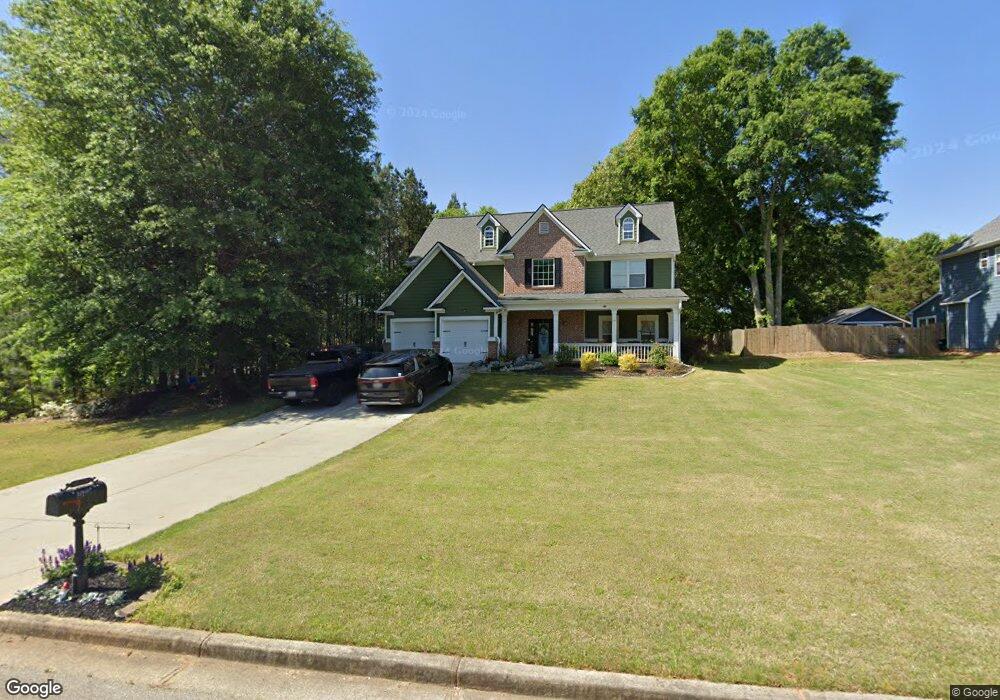
649 Carla Ct Unit 34 Winder, GA 30680
Estimated Value: $387,633 - $434,000
4
Beds
3
Baths
2,513
Sq Ft
$165/Sq Ft
Est. Value
About This Home
This home is located at 649 Carla Ct Unit 34, Winder, GA 30680 and is currently estimated at $414,408, approximately $164 per square foot. 649 Carla Ct Unit 34 is a home located in Barrow County with nearby schools including Holsenbeck Elementary School, Bear Creek Middle School, and Winder-Barrow High School.
Ownership History
Date
Name
Owned For
Owner Type
Purchase Details
Closed on
Dec 20, 2019
Sold by
Teasley George J
Bought by
Montgomery Ivy Amber and Montgomery Clyde Andrew
Current Estimated Value
Home Financials for this Owner
Home Financials are based on the most recent Mortgage that was taken out on this home.
Original Mortgage
$196,000
Outstanding Balance
$172,802
Interest Rate
3.6%
Mortgage Type
New Conventional
Estimated Equity
$241,606
Purchase Details
Closed on
Jul 8, 2014
Sold by
Teasley Natalie H
Bought by
Teasley George J
Purchase Details
Closed on
May 29, 2007
Sold by
Camar Properties Inc
Bought by
Teasley George J And
Purchase Details
Closed on
Nov 2, 2006
Sold by
Casta Development Inc
Bought by
Camar Properties Inc
Purchase Details
Closed on
Jan 19, 2004
Sold by
Flanagan Shane
Bought by
Casta Development Inc
Create a Home Valuation Report for This Property
The Home Valuation Report is an in-depth analysis detailing your home's value as well as a comparison with similar homes in the area
Home Values in the Area
Average Home Value in this Area
Purchase History
| Date | Buyer | Sale Price | Title Company |
|---|---|---|---|
| Montgomery Ivy Amber | $245,000 | -- | |
| Teasley George J | -- | -- | |
| Teasley George J And | $205,000 | -- | |
| Camar Properties Inc | $43,500 | -- | |
| Casta Development Inc | -- | -- |
Source: Public Records
Mortgage History
| Date | Status | Borrower | Loan Amount |
|---|---|---|---|
| Open | Montgomery Ivy Amber | $196,000 |
Source: Public Records
Tax History Compared to Growth
Tax History
| Year | Tax Paid | Tax Assessment Tax Assessment Total Assessment is a certain percentage of the fair market value that is determined by local assessors to be the total taxable value of land and additions on the property. | Land | Improvement |
|---|---|---|---|---|
| 2024 | $3,192 | $126,364 | $18,000 | $108,364 |
| 2023 | $3,192 | $126,764 | $18,000 | $108,764 |
| 2022 | $3,117 | $106,600 | $18,000 | $88,600 |
| 2021 | $3,298 | $106,600 | $18,000 | $88,600 |
| 2020 | $2,989 | $96,016 | $18,000 | $78,016 |
| 2019 | $2,604 | $85,170 | $18,000 | $67,170 |
| 2018 | $2,366 | $78,248 | $14,000 | $64,248 |
| 2017 | $2,060 | $70,748 | $14,000 | $56,748 |
| 2016 | $1,920 | $64,793 | $15,200 | $49,593 |
| 2015 | $1,944 | $65,322 | $15,200 | $50,122 |
| 2014 | $1,787 | $59,177 | $8,526 | $50,651 |
| 2013 | -- | $55,430 | $8,526 | $46,904 |
Source: Public Records
Map
Nearby Homes
- 649 Carla Ct
- 647 Carla Ct
- 790 Penny Ln Unit 34
- 790 Penny Ln
- 648 Carla Ct
- 650 Carla Ct
- 646 Carla Ct
- 795 Penny Ln Unit 33
- 795 Penny Ln
- 652 Carla Ct
- 0 Carla Ct Unit 7276654
- 0 Carla Ct Unit 2781401
- 0 Carla Ct Unit 2781398
- 0 Carla Ct Unit 2781389
- 0 Carla Ct Unit 2781332
- 0 Carla Ct Unit 2781327
- 0 Carla Ct Unit 2781312
- 0 Carla Ct Unit 2781187
- 0 Carla Ct Unit 7564749
- 0 Carla Ct Unit 7326156