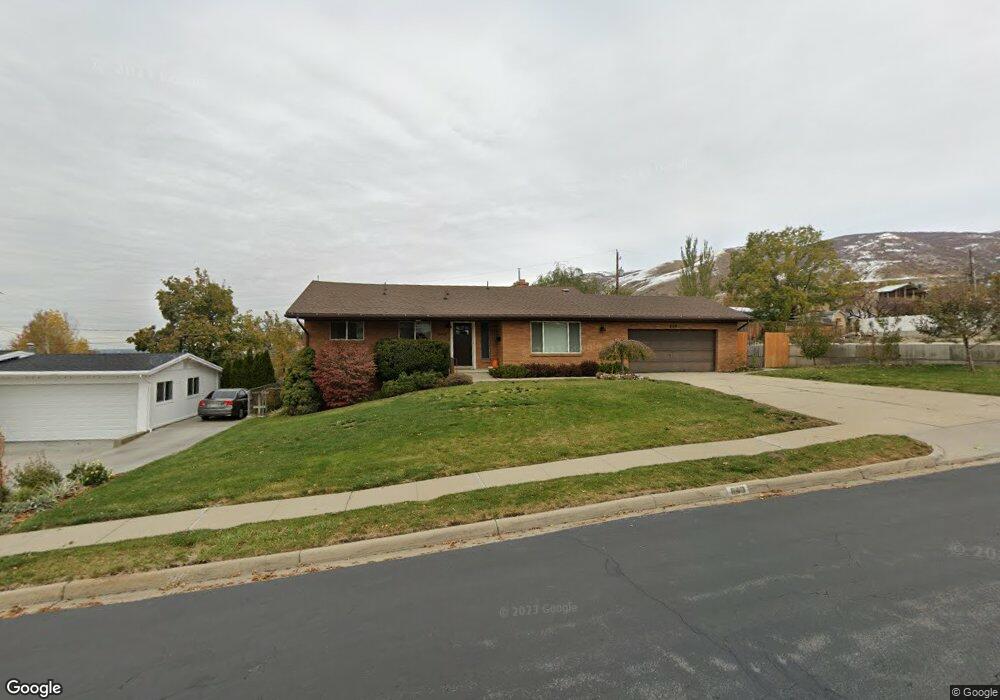
649 E Center St Bountiful, UT 84010
Estimated Value: $581,000 - $643,000
4
Beds
3
Baths
3,134
Sq Ft
$198/Sq Ft
Est. Value
About This Home
This home is located at 649 E Center St, Bountiful, UT 84010 and is currently estimated at $621,545, approximately $198 per square foot. 649 E Center St is a home located in Davis County with nearby schools including Holbrook Elementary School, Bountiful Junior High School, and Bountiful High School.
Ownership History
Date
Name
Owned For
Owner Type
Purchase Details
Closed on
Oct 26, 2022
Sold by
Golson Cordell and Golson Cara
Bought by
Hawke Cory W and Hawke Tara J
Current Estimated Value
Home Financials for this Owner
Home Financials are based on the most recent Mortgage that was taken out on this home.
Original Mortgage
$534,870
Outstanding Balance
$512,987
Interest Rate
6.25%
Mortgage Type
New Conventional
Estimated Equity
$108,558
Purchase Details
Closed on
Feb 9, 2015
Sold by
Golson Cordell Bond and Golson Cordell
Bought by
Golson Cordell and Golson Cara
Purchase Details
Closed on
Nov 18, 2010
Sold by
Openshaw Jeanne Hartvigsen
Bought by
Golson Cordell Bond
Home Financials for this Owner
Home Financials are based on the most recent Mortgage that was taken out on this home.
Original Mortgage
$209,549
Interest Rate
3.75%
Mortgage Type
FHA
Create a Home Valuation Report for This Property
The Home Valuation Report is an in-depth analysis detailing your home's value as well as a comparison with similar homes in the area
Purchase History
| Date | Buyer | Sale Price | Title Company |
|---|---|---|---|
| Hawke Cory W | -- | Homic Title Inc | |
| Golson Cordell | -- | None Available | |
| Golson Cordell Bond | -- | Security Title Of Davis Cnty |
Source: Public Records
Mortgage History
| Date | Status | Borrower | Loan Amount |
|---|---|---|---|
| Open | Hawke Cory W | $534,870 | |
| Previous Owner | Golson Cordell Bond | $209,549 |
Source: Public Records
Tax History
| Year | Tax Paid | Tax Assessment Tax Assessment Total Assessment is a certain percentage of the fair market value that is determined by local assessors to be the total taxable value of land and additions on the property. | Land | Improvement |
|---|---|---|---|---|
| 2025 | $3,611 | $330,000 | $137,851 | $192,149 |
| 2024 | $3,526 | $320,100 | $127,037 | $193,063 |
| 2023 | $3,244 | $556,000 | $231,155 | $324,845 |
| 2022 | $2,980 | $278,300 | $123,201 | $155,099 |
| 2021 | $2,681 | $383,000 | $183,182 | $199,818 |
| 2020 | $2,375 | $340,000 | $166,779 | $173,221 |
| 2019 | $2,408 | $337,000 | $162,482 | $174,518 |
| 2018 | $2,239 | $308,000 | $151,181 | $156,819 |
| 2016 | $1,965 | $146,520 | $48,731 | $97,789 |
| 2015 | $1,925 | $135,465 | $49,725 | $85,740 |
| 2014 | $1,893 | $137,171 | $49,725 | $87,446 |
| 2013 | -- | $121,794 | $43,945 | $77,849 |
Source: Public Records
Map
Nearby Homes
- 345 N 400 E
- 520 S Orchard Dr Unit 17
- 275 E Peach Ln S
- 337 Peach Ln
- 323 Peach Ln
- 49 E 200 N Unit 4
- 551 N 1100 E
- 41 E 200 N Unit 6
- 55 E 200 N Unit 2
- 51 E 200 N Unit 3
- 254 N Main St
- 256 N Main St
- 252 N Main St
- 1023 E 800 N
- 1105 E 600 N
- 545 S 100 E
- 32 W 400 S
- 975 E 1050 N
- 34 W 400 S
- 908 Northern Hills Dr
Your Personal Tour Guide
Ask me questions while you tour the home.