Estimated Value: $248,000 - $326,000
3
Beds
3
Baths
1,809
Sq Ft
$160/Sq Ft
Est. Value
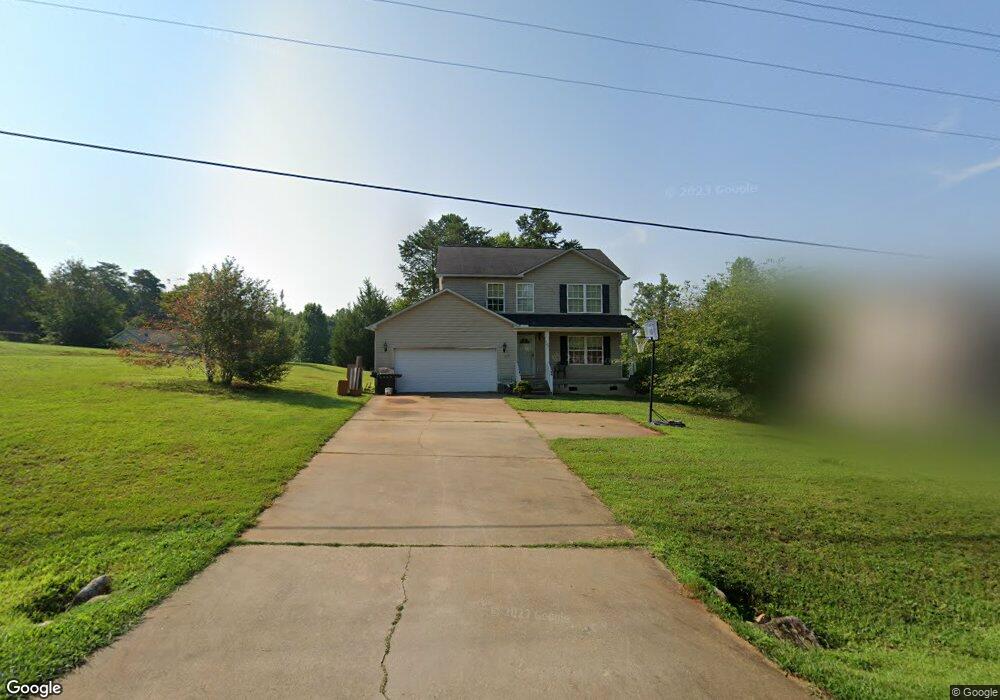
About This Home
This home is located at 649 Jordan Creek Rd, Inman, SC 29349 and is currently estimated at $288,638, approximately $159 per square foot. 649 Jordan Creek Rd is a home located in Spartanburg County with nearby schools including Dorman High School Freshman Campus, Dorman High School, and Inman Christian Academy.
Ownership History
Date
Name
Owned For
Owner Type
Purchase Details
Closed on
Dec 12, 2023
Sold by
Harry Lancaster Jr Revocable Trust
Bought by
Woessner William M
Current Estimated Value
Purchase Details
Closed on
Jan 28, 2021
Sold by
Lancaster Harry
Bought by
Harry Lancaster Jr Revocable Trust and Lancaster
Purchase Details
Closed on
Jan 21, 2021
Sold by
Lancaster Harry
Bought by
Lancaster Harry and The Harry Lancaster Jr Revocab
Purchase Details
Closed on
Mar 1, 2011
Sold by
Wylie Henry U and Wylie Mitzy G
Bought by
Lancaster Harry
Home Financials for this Owner
Home Financials are based on the most recent Mortgage that was taken out on this home.
Original Mortgage
$63,750
Interest Rate
4.77%
Mortgage Type
New Conventional
Purchase Details
Closed on
Jan 13, 2004
Sold by
Durham Construction Inc
Bought by
Wylie Henry U and Wylie Mitzy G
Create a Home Valuation Report for This Property
The Home Valuation Report is an in-depth analysis detailing your home's value as well as a comparison with similar homes in the area
Home Values in the Area
Average Home Value in this Area
Purchase History
| Date | Buyer | Sale Price | Title Company |
|---|---|---|---|
| Woessner William M | $159,321 | -- | |
| Harry Lancaster Jr Revocable Trust | -- | None Listed On Document | |
| Lancaster Harry | -- | None Available | |
| Lancaster Harry | $75,000 | -- | |
| Wylie Henry U | $160,000 | -- |
Source: Public Records
Mortgage History
| Date | Status | Borrower | Loan Amount |
|---|---|---|---|
| Previous Owner | Lancaster Harry | $63,750 |
Source: Public Records
Tax History Compared to Growth
Tax History
| Year | Tax Paid | Tax Assessment Tax Assessment Total Assessment is a certain percentage of the fair market value that is determined by local assessors to be the total taxable value of land and additions on the property. | Land | Improvement |
|---|---|---|---|---|
| 2025 | $898 | $5,290 | $752 | $4,538 |
| 2024 | $898 | $5,290 | $752 | $4,538 |
| 2023 | $898 | $7,935 | $1,128 | $6,807 |
| 2022 | $2,590 | $6,900 | $1,151 | $5,749 |
| 2021 | $2,590 | $6,900 | $1,151 | $5,749 |
| 2020 | $2,569 | $6,900 | $1,151 | $5,749 |
| 2019 | $2,569 | $6,900 | $1,151 | $5,749 |
| 2018 | $2,569 | $6,900 | $1,151 | $5,749 |
| 2017 | $2,197 | $6,000 | $1,200 | $4,800 |
| 2016 | $2,176 | $6,000 | $1,200 | $4,800 |
| 2015 | $2,153 | $6,000 | $1,200 | $4,800 |
| 2014 | $2,101 | $6,000 | $1,200 | $4,800 |
Source: Public Records
Map
Nearby Homes
- 214 Cooleys Crest Ln
- 738 New Ct S
- 730 New Ct S
- The Artic Plan at Emerald Ridge
- The Pellum Plan at Emerald Ridge
- The Deerview Plan at Emerald Ridge
- 726 New Ct S
- The Hampton Plan at Emerald Ridge
- The Belue Plan at Emerald Ridge
- The Bishop Plan at Emerald Ridge
- 734 New Ct S
- 338 Jordan Creek Rd
- 334 Jordan Creek Rd
- 273 State Road S-42-742
- 1430 John Dodd Rd
- 271 State Road S-42-742
- 269 State Road S-42-742
- 265 State Road S-42-742
- 261 State Road S-42-742
- 259 State Road S-42-742
- 655 Jordan Creek Rd
- 643 Jordan Creek Rd
- 659 Jordan Creek Rd
- 203 Aqua Cove Ct
- 210 Anchors Away Dr
- 209 Anchors Away Dr
- 637 Jordan Creek Rd
- 213 Anchors Away Dr
- 110 Shore Heights Dr
- 660 Jordan Creek Rd
- 665 Jordan Creek Rd
- 216 Anchors Away Dr
- 673 Jordan Creek Rd
- 217 Anchors Away Dr
- 670 Jordan Creek Rd
- 220 Anchors Away Dr
- 206 Cooleys Crest Ln
- 111 Shore Heights Dr
- 206 Aqua Cove Ct
- 0 Shore Heights Lot