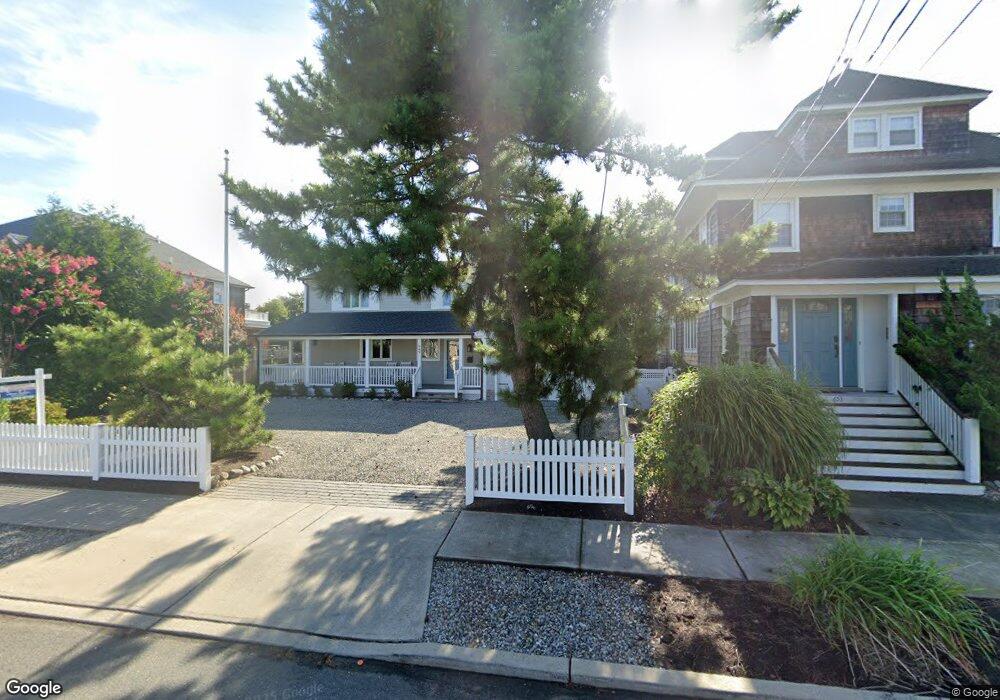
649 Main Ave Unit weekly Bay Head, NJ 08742
Estimated Value: $2,390,000 - $2,917,000
5
Beds
4
Baths
2,124
Sq Ft
$1,256/Sq Ft
Est. Value
About This Home
This home is located at 649 Main Ave Unit weekly, Bay Head, NJ 08742 and is currently estimated at $2,667,909, approximately $1,256 per square foot. 649 Main Ave Unit weekly is a home located in Ocean County with nearby schools including Bay Head Elementary School and St. Peter School.
Ownership History
Date
Name
Owned For
Owner Type
Purchase Details
Closed on
Jul 5, 2005
Sold by
Hurst Ray
Bought by
Salvato Frank J and Salvato Lisa
Current Estimated Value
Home Financials for this Owner
Home Financials are based on the most recent Mortgage that was taken out on this home.
Original Mortgage
$900,000
Outstanding Balance
$472,539
Interest Rate
5.75%
Mortgage Type
Fannie Mae Freddie Mac
Estimated Equity
$2,195,370
Create a Home Valuation Report for This Property
The Home Valuation Report is an in-depth analysis detailing your home's value as well as a comparison with similar homes in the area
Home Values in the Area
Average Home Value in this Area
Purchase History
| Date | Buyer | Sale Price | Title Company |
|---|---|---|---|
| Salvato Frank J | $1,300,000 | Old Republic Title |
Source: Public Records
Mortgage History
| Date | Status | Borrower | Loan Amount |
|---|---|---|---|
| Open | Salvato Frank J | $900,000 |
Source: Public Records
Tax History Compared to Growth
Tax History
| Year | Tax Paid | Tax Assessment Tax Assessment Total Assessment is a certain percentage of the fair market value that is determined by local assessors to be the total taxable value of land and additions on the property. | Land | Improvement |
|---|---|---|---|---|
| 2025 | $12,294 | $1,217,200 | $911,300 | $305,900 |
| 2024 | $11,819 | $1,217,200 | $911,300 | $305,900 |
| 2023 | $10,955 | $1,217,200 | $911,300 | $305,900 |
| 2022 | $10,955 | $1,217,200 | $911,300 | $305,900 |
| 2021 | $10,687 | $1,217,200 | $911,300 | $305,900 |
| 2020 | $10,663 | $1,217,200 | $911,300 | $305,900 |
| 2019 | $10,322 | $1,217,200 | $911,300 | $305,900 |
| 2018 | $10,237 | $1,217,200 | $911,300 | $305,900 |
| 2017 | $9,908 | $1,217,200 | $911,300 | $305,900 |
| 2016 | $10,042 | $1,217,200 | $911,300 | $305,900 |
| 2015 | $10,139 | $1,217,200 | $911,300 | $305,900 |
| 2014 | $9,725 | $1,217,200 | $911,300 | $305,900 |
Source: Public Records
Map
Nearby Homes