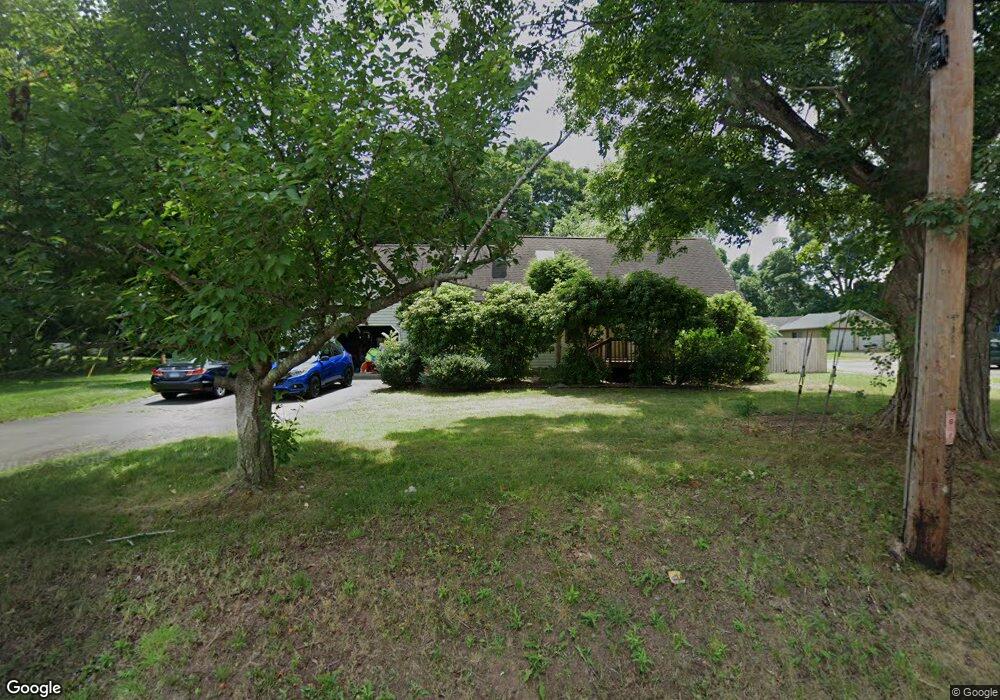
649 N Elm St Wallingford, CT 06492
Estimated Value: $458,000 - $512,000
3
Beds
2
Baths
1,530
Sq Ft
$322/Sq Ft
Est. Value
About This Home
This home is located at 649 N Elm St, Wallingford, CT 06492 and is currently estimated at $493,118, approximately $322 per square foot. 649 N Elm St is a home located in New Haven County with nearby schools including Moses Y Beach Elementary School, Rock Hill Elementary School, and Dag Hammarskjold Middle School.
Ownership History
Date
Name
Owned For
Owner Type
Purchase Details
Closed on
Feb 11, 2010
Sold by
Fdic
Bought by
Ahuja Harpreet S
Current Estimated Value
Home Financials for this Owner
Home Financials are based on the most recent Mortgage that was taken out on this home.
Original Mortgage
$254,221
Interest Rate
5.12%
Mortgage Type
Purchase Money Mortgage
Purchase Details
Closed on
Dec 14, 2009
Sold by
Butt Sohail
Bought by
Amtrust Bk
Home Financials for this Owner
Home Financials are based on the most recent Mortgage that was taken out on this home.
Original Mortgage
$254,221
Interest Rate
5.12%
Mortgage Type
Purchase Money Mortgage
Purchase Details
Closed on
Aug 17, 2005
Sold by
Johnson Sandra C
Bought by
Butt Sohail
Purchase Details
Closed on
Aug 6, 2003
Sold by
Aykroyd Judith A Est and Eallahan
Bought by
Johnson Sandra C
Create a Home Valuation Report for This Property
The Home Valuation Report is an in-depth analysis detailing your home's value as well as a comparison with similar homes in the area
Home Values in the Area
Average Home Value in this Area
Purchase History
| Date | Buyer | Sale Price | Title Company |
|---|---|---|---|
| Ahuja Harpreet S | $263,000 | -- | |
| Ahuja Harpreet S | $263,000 | -- | |
| Amtrust Bk | -- | -- | |
| Amtrust Bk | -- | -- | |
| Butt Sohail | $372,000 | -- | |
| Butt Sohail | $372,000 | -- | |
| Johnson Sandra C | $253,000 | -- | |
| Johnson Sandra C | $253,000 | -- |
Source: Public Records
Mortgage History
| Date | Status | Borrower | Loan Amount |
|---|---|---|---|
| Open | Johnson Sandra C | $252,340 | |
| Closed | Johnson Sandra C | $254,221 |
Source: Public Records
Tax History Compared to Growth
Tax History
| Year | Tax Paid | Tax Assessment Tax Assessment Total Assessment is a certain percentage of the fair market value that is determined by local assessors to be the total taxable value of land and additions on the property. | Land | Improvement |
|---|---|---|---|---|
| 2025 | $6,787 | $281,400 | $112,200 | $169,200 |
| 2024 | $6,012 | $196,100 | $93,500 | $102,600 |
| 2023 | $5,754 | $196,100 | $93,500 | $102,600 |
| 2022 | $5,695 | $196,100 | $93,500 | $102,600 |
| 2021 | $5,593 | $196,100 | $93,500 | $102,600 |
| 2020 | $5,517 | $189,000 | $93,200 | $95,800 |
| 2019 | $5,517 | $189,000 | $93,200 | $95,800 |
| 2018 | $5,413 | $189,000 | $93,200 | $95,800 |
| 2017 | $5,396 | $189,000 | $93,200 | $95,800 |
| 2016 | $5,271 | $189,000 | $93,200 | $95,800 |
| 2015 | $5,310 | $193,300 | $93,200 | $100,100 |
| 2014 | $5,198 | $193,300 | $93,200 | $100,100 |
Source: Public Records
Map
Nearby Homes
- 4 Sunset Dr
- 5 Stegos Dr
- 6 Kovacs Place
- 1 Pine Glen Terrace
- 690 N Colony Rd Unit 15
- 37 Laurelwood Dr
- 49 High St
- 940 Durham Rd
- 29 Curtis Ave
- 11 Westview Dr
- 40 Lake St
- 43 Academy St
- 230 Main St Unit 49
- 230 Main St Unit 18
- 230 Main St Unit 43
- 530 Center St Unit C1
- 85 N Colony St
- 380 Main St Unit 3
- 380 Main St Unit 7
- 380 Main St Unit 4