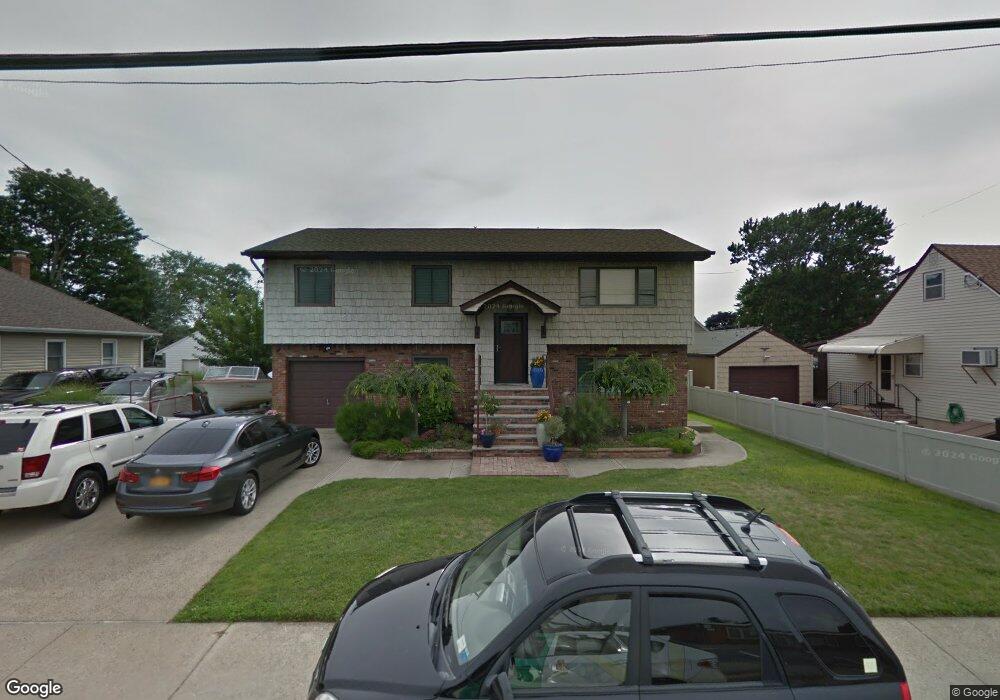
649 S Walnut St Lindenhurst, NY 11757
Estimated Value: $702,000 - $819,000
--
Bed
--
Bath
2,048
Sq Ft
$365/Sq Ft
Est. Value
About This Home
This home is located at 649 S Walnut St, Lindenhurst, NY 11757 and is currently estimated at $746,546, approximately $364 per square foot. 649 S Walnut St is a home located in Suffolk County with nearby schools including Lindenhurst Middle School and Lindenhurst Senior High School.
Ownership History
Date
Name
Owned For
Owner Type
Purchase Details
Closed on
Jul 2, 2012
Sold by
Weckerle Leonard E and Weckerle Josephine
Bought by
Jiritano Glenn
Current Estimated Value
Home Financials for this Owner
Home Financials are based on the most recent Mortgage that was taken out on this home.
Original Mortgage
$268,000
Outstanding Balance
$185,783
Interest Rate
3.76%
Mortgage Type
Purchase Money Mortgage
Estimated Equity
$560,763
Purchase Details
Closed on
Mar 13, 1999
Sold by
Weckerle Leonard E and Weckerle Josephine
Bought by
Weckerle Leonard E and Weckerle Josephine
Create a Home Valuation Report for This Property
The Home Valuation Report is an in-depth analysis detailing your home's value as well as a comparison with similar homes in the area
Home Values in the Area
Average Home Value in this Area
Purchase History
| Date | Buyer | Sale Price | Title Company |
|---|---|---|---|
| Jiritano Glenn | $335,000 | Hallmark Abstract Svcs Llc | |
| Weckerle Leonard E | -- | -- |
Source: Public Records
Mortgage History
| Date | Status | Borrower | Loan Amount |
|---|---|---|---|
| Open | Jiritano Glenn | $268,000 |
Source: Public Records
Tax History Compared to Growth
Tax History
| Year | Tax Paid | Tax Assessment Tax Assessment Total Assessment is a certain percentage of the fair market value that is determined by local assessors to be the total taxable value of land and additions on the property. | Land | Improvement |
|---|---|---|---|---|
| 2024 | $15,128 | $4,110 | $220 | $3,890 |
| 2023 | $13,702 | $4,110 | $220 | $3,890 |
| 2022 | $10,982 | $4,110 | $220 | $3,890 |
| 2021 | $10,982 | $4,110 | $220 | $3,890 |
| 2020 | $12,721 | $4,110 | $220 | $3,890 |
| 2019 | $13,976 | $0 | $0 | $0 |
| 2018 | $10,867 | $4,110 | $220 | $3,890 |
| 2017 | $10,867 | $4,110 | $220 | $3,890 |
| 2016 | $10,914 | $4,110 | $220 | $3,890 |
| 2015 | -- | $4,110 | $220 | $3,890 |
| 2014 | -- | $4,110 | $220 | $3,890 |
Source: Public Records
Map
Nearby Homes