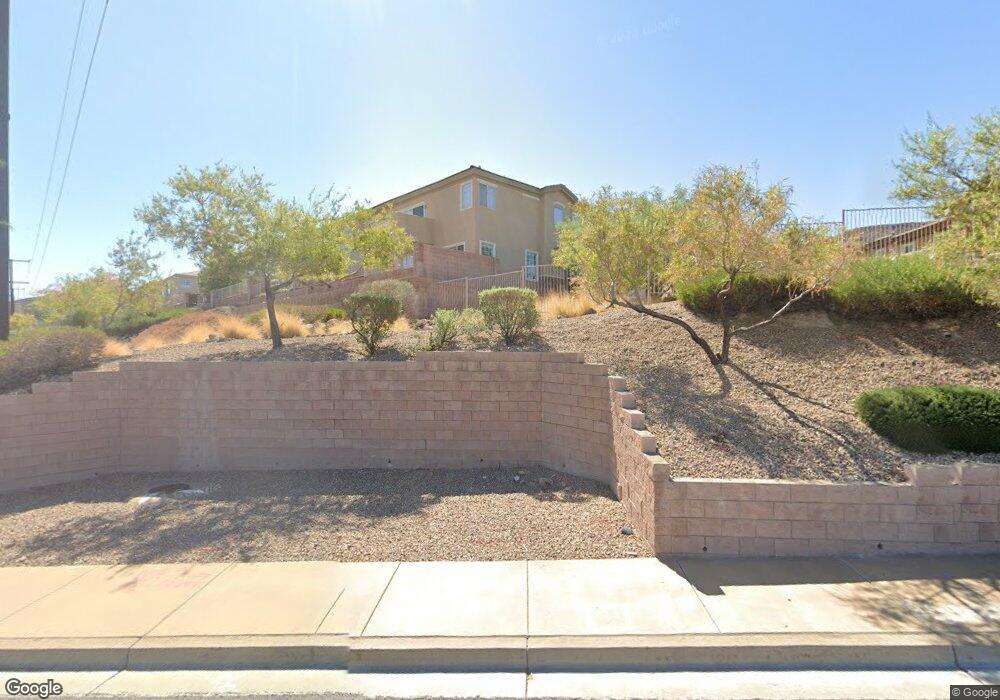
649 Solitude Point Ave Henderson, NV 89012
McCullough Hills NeighborhoodEstimated Value: $358,000 - $384,000
3
Beds
4
Baths
1,371
Sq Ft
$268/Sq Ft
Est. Value
About This Home
This home is located at 649 Solitude Point Ave, Henderson, NV 89012 and is currently estimated at $367,071, approximately $267 per square foot. 649 Solitude Point Ave is a home located in Clark County with nearby schools including Ulis Newton Elementary School, Jack & Terry Mannion Middle School, and Foothill High School.
Ownership History
Date
Name
Owned For
Owner Type
Purchase Details
Closed on
Aug 5, 2013
Sold by
Mcmahon Heidi E
Bought by
Ho Christine
Current Estimated Value
Purchase Details
Closed on
Dec 17, 2007
Sold by
Barnett Lori M and Fuller Lori M
Bought by
Mcmahon Heidi E
Home Financials for this Owner
Home Financials are based on the most recent Mortgage that was taken out on this home.
Original Mortgage
$214,400
Interest Rate
6.15%
Mortgage Type
Unknown
Purchase Details
Closed on
Aug 30, 2001
Sold by
Calabrese Roberta M
Bought by
Fuller Lori M
Home Financials for this Owner
Home Financials are based on the most recent Mortgage that was taken out on this home.
Original Mortgage
$135,756
Interest Rate
6.91%
Mortgage Type
FHA
Purchase Details
Closed on
Feb 28, 2000
Sold by
The American Black Mountain Ltd Prtnrshp
Bought by
Calabrese Roberta M
Home Financials for this Owner
Home Financials are based on the most recent Mortgage that was taken out on this home.
Original Mortgage
$110,303
Interest Rate
8.16%
Create a Home Valuation Report for This Property
The Home Valuation Report is an in-depth analysis detailing your home's value as well as a comparison with similar homes in the area
Home Values in the Area
Average Home Value in this Area
Purchase History
| Date | Buyer | Sale Price | Title Company |
|---|---|---|---|
| Ho Christine | $96,900 | Chicago Title Las Vegas | |
| Mcmahon Heidi E | $214,400 | Equity Title Of Nevada | |
| Barnett Lori M | -- | Equity Title Of Nevada | |
| Fuller Lori M | $137,900 | Fidelity National Title | |
| Calabrese Roberta M | $122,559 | Nevada Title Company |
Source: Public Records
Mortgage History
| Date | Status | Borrower | Loan Amount |
|---|---|---|---|
| Previous Owner | Mcmahon Heidi E | $214,400 | |
| Previous Owner | Fuller Lori M | $135,756 | |
| Previous Owner | Calabrese Roberta M | $110,303 |
Source: Public Records
Tax History
| Year | Tax Paid | Tax Assessment Tax Assessment Total Assessment is a certain percentage of the fair market value that is determined by local assessors to be the total taxable value of land and additions on the property. | Land | Improvement |
|---|---|---|---|---|
| 2026 | $1,736 | $85,463 | $36,050 | $49,413 |
| 2025 | $1,607 | $83,847 | $34,300 | $49,547 |
| 2024 | $1,489 | $83,847 | $34,300 | $49,547 |
| 2023 | $1,489 | $74,225 | $29,050 | $45,175 |
| 2022 | $1,379 | $68,854 | $25,900 | $42,954 |
| 2021 | $1,277 | $57,526 | $22,400 | $35,126 |
| 2020 | $1,183 | $56,981 | $20,300 | $36,681 |
| 2019 | $1,108 | $54,289 | $17,850 | $36,439 |
| 2018 | $1,058 | $49,576 | $14,700 | $34,876 |
| 2017 | $991 | $47,742 | $13,300 | $34,442 |
| 2016 | $991 | $45,747 | $11,550 | $34,197 |
| 2015 | $981 | $37,862 | $7,700 | $30,162 |
| 2014 | $951 | $34,159 | $7,000 | $27,159 |
Source: Public Records
Map
Nearby Homes
- 207 Priority Point St
- 228 Priority Point St
- 677 Principle Point Ave
- 194 Kings Canyon Ct
- 192 Mount Saint Helens Dr
- 739 Solitude Point Ave
- 742 Solitude Point Ave
- 763 Solitude Point Ave
- 218 Shaded Canyon Dr
- 755 Camino Del Ray
- 795 Camino la Paz
- 136 Camino Francisco
- 463 Palegold St
- 105 Richland Hills Ave
- 138 Camino Capri
- 216 Glen Lee St
- 727 Camino la Paz
- 824 Plockton Ave
- 270 Shaded Canyon Dr
- 840 Tarbet Ave
- 647 Solitude Point Ave
- 651 Solitude Point Ave
- 645 Solitude Point Ave Unit 1
- 643 Solitude Point Ave
- 659 Solitude Point Ave
- 650 Solitude Point Ave
- 648 Solitude Point Ave
- 652 Solitude Point Ave
- 646 Solitude Point Ave
- 641 Solitude Point Ave Unit none
- 641 Solitude Point Ave
- 661 Solitude Point Ave
- 661 Solitude Point Ave
- 654 Solitude Point Ave Unit 1
- 654 Integrity Point Ave
- 656 Integrity Point Ave
- 652 Integrity Point Ave
- 658 Integrity Point Ave
- 658 Integrity Point Ave
- 658 Integrity Point Ave
Your Personal Tour Guide
Ask me questions while you tour the home.