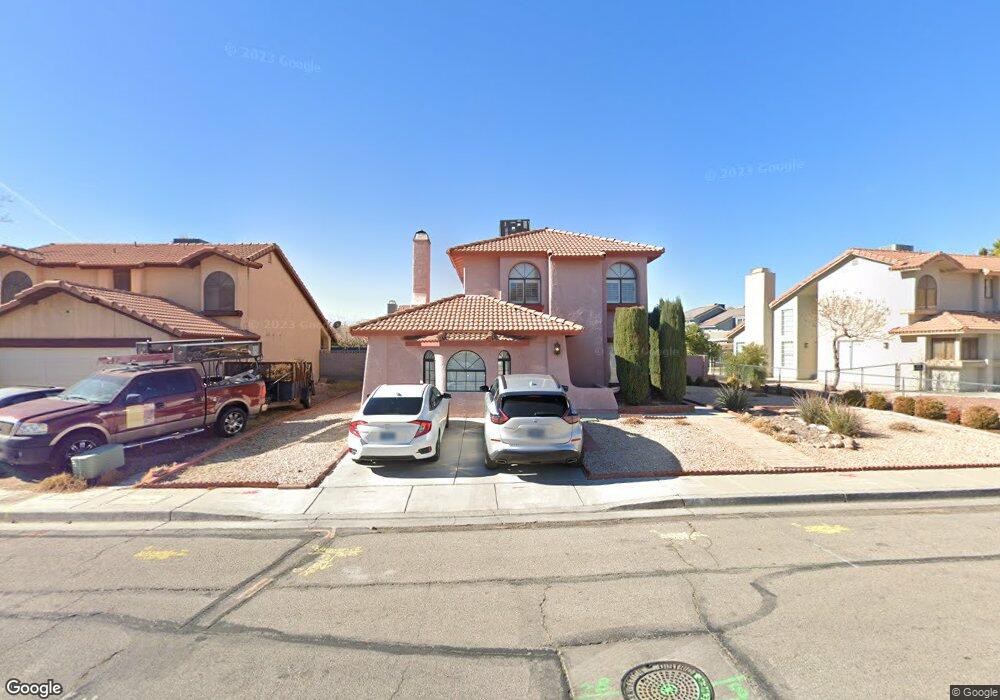
649 Summer Heights Ln Las Vegas, NV 89110
Estimated Value: $414,484 - $482,000
4
Beds
3
Baths
2,050
Sq Ft
$214/Sq Ft
Est. Value
About This Home
This home is located at 649 Summer Heights Ln, Las Vegas, NV 89110 and is currently estimated at $438,121, approximately $213 per square foot. 649 Summer Heights Ln is a home located in Clark County with nearby schools including Richard J. Rundle Elementary School, Charlotte & Jerry Keller Elementary School, and Duane D. Keller Middle School.
Ownership History
Date
Name
Owned For
Owner Type
Purchase Details
Closed on
Aug 26, 1996
Sold by
Ross James
Bought by
Ross Dorothy J
Current Estimated Value
Create a Home Valuation Report for This Property
The Home Valuation Report is an in-depth analysis detailing your home's value as well as a comparison with similar homes in the area
Home Values in the Area
Average Home Value in this Area
Purchase History
| Date | Buyer | Sale Price | Title Company |
|---|---|---|---|
| Ross Dorothy J | -- | -- |
Source: Public Records
Tax History Compared to Growth
Tax History
| Year | Tax Paid | Tax Assessment Tax Assessment Total Assessment is a certain percentage of the fair market value that is determined by local assessors to be the total taxable value of land and additions on the property. | Land | Improvement |
|---|---|---|---|---|
| 2025 | $1,476 | $69,439 | $27,300 | $42,139 |
| 2024 | $1,367 | $69,439 | $27,300 | $42,139 |
| 2023 | $1,367 | $71,268 | $30,450 | $40,818 |
| 2022 | $1,266 | $61,747 | $24,150 | $37,597 |
| 2021 | $1,173 | $57,054 | $21,000 | $36,054 |
| 2020 | $1,086 | $57,253 | $21,000 | $36,253 |
| 2019 | $1,018 | $53,495 | $17,500 | $35,995 |
| 2018 | $971 | $49,977 | $15,400 | $34,577 |
| 2017 | $1,392 | $47,472 | $12,250 | $35,222 |
| 2016 | $1,162 | $41,798 | $8,050 | $33,748 |
| 2015 | $1,159 | $41,293 | $6,650 | $34,643 |
| 2014 | $1,133 | $33,560 | $4,550 | $29,010 |
Source: Public Records
Map
Nearby Homes
- 741 Round Table Dr
- 522 Wheaties Way
- 5529 Cedar Ave
- 740 Santree Cir
- 5854 Heather Marie Dr
- 656 N Christy Ln
- 730 N Christy Ln
- 910 N Sloan Ln Unit 201
- 563 Moon Chase St
- 0 Washington Unit 2360795
- 316 Linn Ln
- 5907 Zawawi Ct
- 262 Solicito St
- 266 Lyra Ln
- 5717 Christchurch Ave
- 5923 Halehaven Dr
- 6209 Exquisite Ave
- 0 Madge Ln
- 796 Ringwood Ln
- 360 Sir Richard Dr E
- 639 Summer Heights Ln
- 632 Weathervane Ct
- 626 Weathervane Ct
- 669 Summer Heights Ln
- 629 Summer Heights Ln
- 638 Weathervane Ct
- 620 Weathervane Ct
- 650 Summer Heights Ln
- 640 Summer Heights Ln
- 679 Summer Heights Ln
- 660 Summer Heights Ln
- 619 Summer Heights Ln
- 644 Weathervane Ct
- 612 Weathervane Ct
- 630 Summer Heights Ln
- 630 Summer Heights Ln Unit na
- 670 Summer Heights Ln
- 5832 Butterum Ct
- 689 Summer Heights Ln Unit 2
- 650 Weathervane Ct